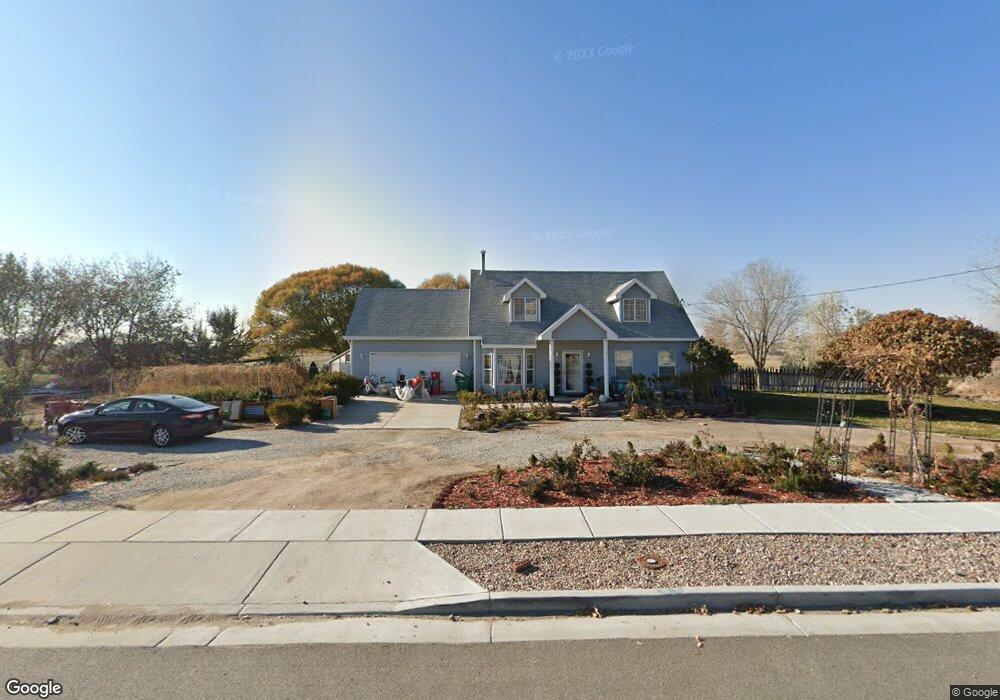
5237 S 4700 W Hooper, UT 84315
Estimated Value: $582,000 - $623,000
--
Bed
3
Baths
2,216
Sq Ft
$272/Sq Ft
Est. Value
About This Home
This home is located at 5237 S 4700 W, Hooper, UT 84315 and is currently estimated at $603,303, approximately $272 per square foot. 5237 S 4700 W is a home located in Weber County with nearby schools including Country View School, Rocky Mountain Junior High School, and Quest Academy.
Ownership History
Date
Name
Owned For
Owner Type
Purchase Details
Closed on
Nov 26, 2001
Sold by
Christensen Kelly D
Bought by
Christensen Kelly D and Christensen Kelli C
Current Estimated Value
Purchase Details
Closed on
Feb 24, 1998
Sold by
Butler Timothy W
Bought by
Christensen Kelly D and Christensen Kelli C
Home Financials for this Owner
Home Financials are based on the most recent Mortgage that was taken out on this home.
Original Mortgage
$135,072
Outstanding Balance
$24,448
Interest Rate
6.9%
Mortgage Type
FHA
Estimated Equity
$578,855
Purchase Details
Closed on
Jul 22, 1997
Sold by
Christensen Kelly D
Bought by
Butler Timothy W and Great American Homes
Home Financials for this Owner
Home Financials are based on the most recent Mortgage that was taken out on this home.
Original Mortgage
$106,070
Interest Rate
7.7%
Mortgage Type
Construction
Create a Home Valuation Report for This Property
The Home Valuation Report is an in-depth analysis detailing your home's value as well as a comparison with similar homes in the area
Home Values in the Area
Average Home Value in this Area
Purchase History
| Date | Buyer | Sale Price | Title Company |
|---|---|---|---|
| Christensen Kelly D | -- | Surety Title Agency | |
| Christensen Kelly D | -- | Security Title Agency | |
| Christensen Kelly D | -- | Bonneville Title Company | |
| Butler Timothy W | -- | Bonneville Title |
Source: Public Records
Mortgage History
| Date | Status | Borrower | Loan Amount |
|---|---|---|---|
| Open | Christensen Kelly D | $135,072 | |
| Previous Owner | Butler Timothy W | $106,070 |
Source: Public Records
Tax History
| Year | Tax Paid | Tax Assessment Tax Assessment Total Assessment is a certain percentage of the fair market value that is determined by local assessors to be the total taxable value of land and additions on the property. | Land | Improvement |
|---|---|---|---|---|
| 2025 | $2,629 | $482,819 | $179,965 | $302,854 |
| 2024 | $2,533 | $261,395 | $98,980 | $162,415 |
| 2023 | $2,660 | $271,225 | $123,748 | $147,477 |
| 2022 | $2,871 | $297,551 | $99,002 | $198,549 |
| 2021 | $2,325 | $404,999 | $110,068 | $294,931 |
| 2020 | $2,165 | $346,000 | $90,008 | $255,992 |
| 2019 | $2,156 | $325,999 | $63,000 | $262,999 |
| 2018 | $2,077 | $300,998 | $63,000 | $237,998 |
| 2017 | $1,870 | $263,000 | $63,000 | $200,000 |
| 2016 | $1,670 | $127,658 | $24,798 | $102,860 |
| 2015 | $1,625 | $122,760 | $24,798 | $97,962 |
| 2014 | $1,629 | $115,082 | $29,150 | $85,932 |
Source: Public Records
Map
Nearby Homes
- 4700 W 5500 S
- 4931 S 4700 W
- 4367 W 5300 S
- 4337 W 5430 St S A S Unit A
- 4309 W 5430 St #B S
- 4277 W 5250 S
- 4879 S 5050 W
- 3632 S 5400 W
- 4836 S 5050 W
- 4216 W 5250 S
- 4403 W 5700 S
- 4218 W 5050 S
- 4853 S 4275 W Unit 27
- 4088 W 5050 S
- 5335 W 5500 S
- 5444 S 4050 W
- 3959 W 5325 S
- 4021 W 5625 S
- 5412 S 3925 W
- 4486 S 4300 W
Your Personal Tour Guide
Ask me questions while you tour the home.