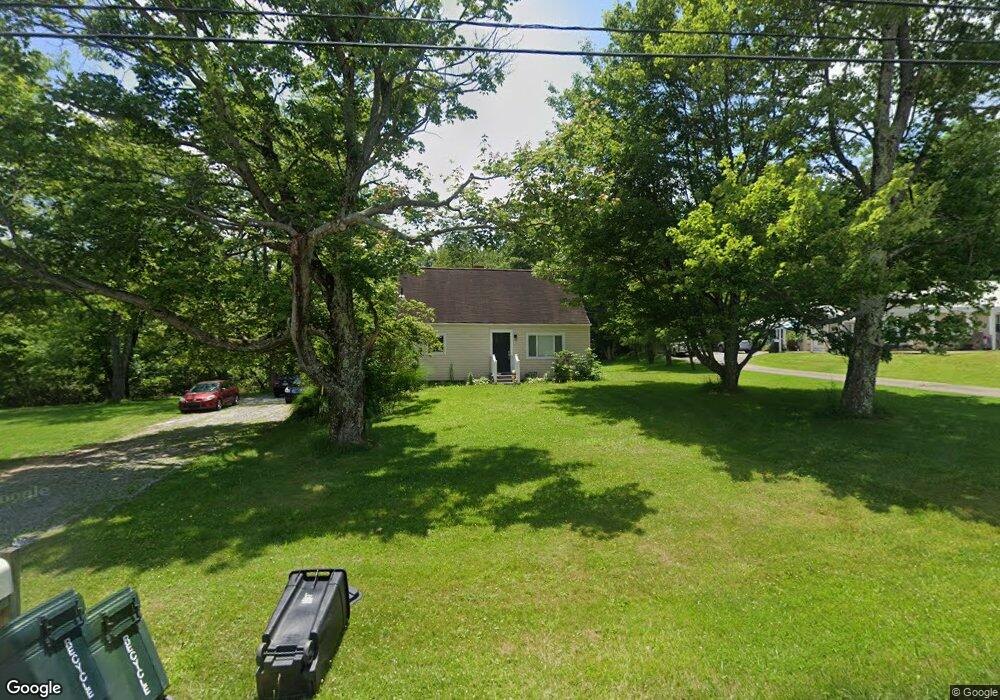
5238 Middle Rd Gibsonia, PA 15044
West Deer Township NeighborhoodEstimated Value: $127,000 - $289,420
About This Home
Charming Cape Cod completely renovated single family home. The kitchen has white shaker cabinets with plenty of storage, gorgeous white quartz countertops including the kitchen island with counter seating. The kitchen opens into the living room giving you a nice open floor plan with new lighting installed throughout the home. Refinished hardwood floors throughout the first floor.
A large side deck sits off the kitchen for entertaining. The bathroom has been completely renovated with new vanity, tub, subway tile, new fixtures, lighting and flooring. The home has a large basement (great for storage) and laundry hook ups). This home sits on a wooded half acre allowing privacy. Community’s of Hampton ,West Deer, Richland are minutes away including shops restaurants, hospitals and schools, as well as The Pa. Turnpike, Rt8 and 910. Come and see this lovely home. Pets/ Dog negotiable
Ownership History
Purchase Details
Purchase Details
Purchase Details
Home Values in the Area
Average Home Value in this Area
Purchase History
| Date | Buyer | Sale Price | Title Company |
|---|---|---|---|
| Certo John Michael | $120,000 | -- | |
| Penn Crest Ii L L C | $118,000 | -- | |
| Penn Crest Ii Llc | $118,000 | -- |
Property History
| Date | Event | Price | List to Sale | Price per Sq Ft |
|---|---|---|---|---|
| 12/25/2024 12/25/24 | Off Market | $2,100 | -- | -- |
| 11/21/2024 11/21/24 | For Rent | $2,100 | 0.0% | -- |
| 11/21/2024 11/21/24 | Price Changed | $2,100 | -4.5% | $2 / Sq Ft |
| 11/10/2024 11/10/24 | Off Market | $2,200 | -- | -- |
| 10/08/2024 10/08/24 | Off Market | $2,500 | -- | -- |
| 10/08/2024 10/08/24 | Price Changed | $2,200 | -12.0% | $2 / Sq Ft |
| 09/25/2024 09/25/24 | For Rent | $2,500 | 0.0% | -- |
| 09/24/2024 09/24/24 | For Rent | $2,500 | -- | -- |
Tax History Compared to Growth
Tax History
| Year | Tax Paid | Tax Assessment Tax Assessment Total Assessment is a certain percentage of the fair market value that is determined by local assessors to be the total taxable value of land and additions on the property. | Land | Improvement |
|---|---|---|---|---|
| 2025 | $3,717 | $122,600 | $51,900 | $70,700 |
| 2024 | $3,717 | $122,600 | $51,900 | $70,700 |
| 2023 | $3,728 | $122,600 | $51,900 | $70,700 |
| 2022 | $3,728 | $122,600 | $51,900 | $70,700 |
| 2021 | $3,638 | $122,600 | $51,900 | $70,700 |
| 2020 | $3,638 | $122,600 | $51,900 | $70,700 |
| 2019 | $3,638 | $122,600 | $51,900 | $70,700 |
| 2018 | $580 | $122,600 | $51,900 | $70,700 |
| 2017 | $3,638 | $122,600 | $51,900 | $70,700 |
| 2016 | $580 | $122,600 | $51,900 | $70,700 |
| 2015 | $580 | $122,600 | $51,900 | $70,700 |
| 2014 | $3,515 | $122,600 | $51,900 | $70,700 |
Map
- 213 Lawrence Ct
- 5096 Fountainwood Dr
- 5066 Harvest Ln
- 142 Partridge Run Rd
- 5025 Meadow Crest Dr
- 3255 E Hardies Rd
- 153 Pintail Rd
- 4839 Tremont Dr
- 313 Luke Ct
- 4959 Meadow Crest Dr
- 4929 Apple Ridge Dr
- 109 Steeplechase Cir Unit BLDG1
- 113 Steeplechase Cir Unit BLDG1
- 110 Steeplechase Cir Unit BLDG1
- 121 Steeplechase Cir Unit BLDG1
- 3530 Woodlake Dr
- 5047 Meadowridge Ln
- 136 Raccoon Way
- 3432 Cedar Glen Dr
- 3118 Haberlein Rd
- 5243 Middle Rd
- 5210 Middle Rd
- 5231 Middle Rd
- 5249 Middle Rd
- 5310 Middle Rd
- 203 Lawrence Ct
- 5232 Middle Rd
- 205 Lawrence Ct
- 200 Lawrence Ct
- 5314 Middle Rd
- 202 Lawrence Ct
- 5049 Middle Rd
- 204 Lawrence Ct
- 5318 Middle Rd
- 206 Lawrence Ct
- 209 Lawrence Ct
- 208 Lawrence Ct
- 310 Quail Ridge Ct
- 5000 Middle Rd
- 211 Lawrence Ct