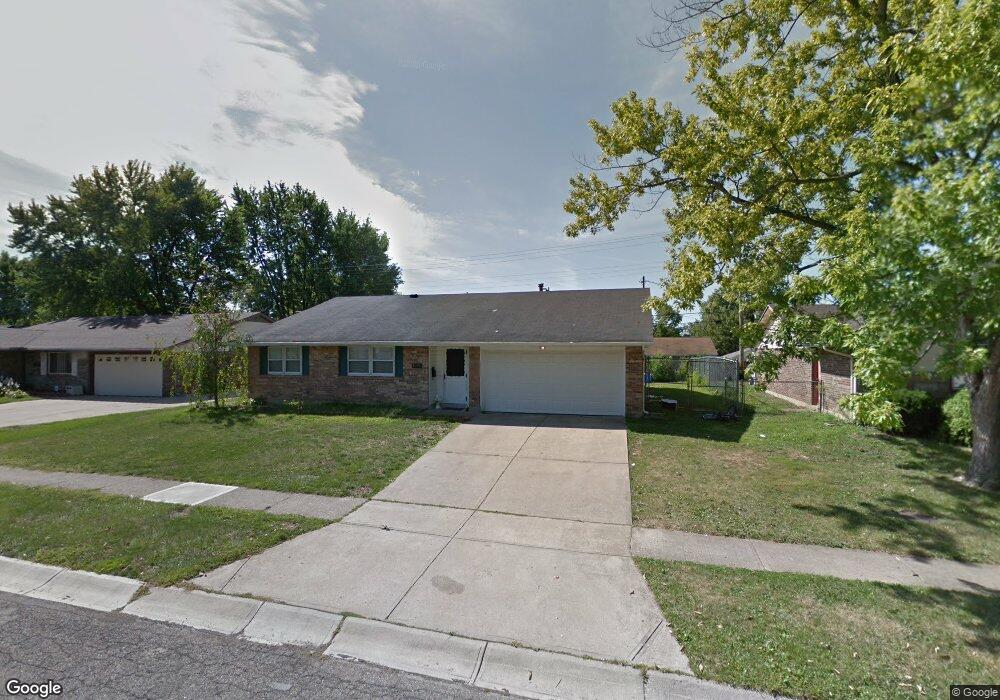
5238 Pitcairn Rd Dayton, OH 45424
Estimated Value: $206,066 - $239,000
3
Beds
2
Baths
1,698
Sq Ft
$130/Sq Ft
Est. Value
About This Home
This home is located at 5238 Pitcairn Rd, Dayton, OH 45424 and is currently estimated at $220,267, approximately $129 per square foot. 5238 Pitcairn Rd is a home located in Montgomery County with nearby schools including Wayne High School and Pathway School of Discovery.
Ownership History
Date
Name
Owned For
Owner Type
Purchase Details
Closed on
Jan 25, 2015
Sold by
Richmonds Enterprise Inc
Bought by
Richmond Jeffery G
Current Estimated Value
Purchase Details
Closed on
Oct 23, 2006
Sold by
Customized Performance Solutions Inc
Bought by
Richmond Jeffery G
Home Financials for this Owner
Home Financials are based on the most recent Mortgage that was taken out on this home.
Original Mortgage
$100,800
Interest Rate
8.37%
Mortgage Type
Purchase Money Mortgage
Purchase Details
Closed on
May 30, 2002
Sold by
Stazel George Donald
Bought by
Customized Performance Solutions Inc and 5238 Pitcairn Road Land Trust
Home Financials for this Owner
Home Financials are based on the most recent Mortgage that was taken out on this home.
Original Mortgage
$64,500
Interest Rate
6.87%
Create a Home Valuation Report for This Property
The Home Valuation Report is an in-depth analysis detailing your home's value as well as a comparison with similar homes in the area
Home Values in the Area
Average Home Value in this Area
Purchase History
| Date | Buyer | Sale Price | Title Company |
|---|---|---|---|
| Richmond Jeffery G | -- | None Available | |
| Richmond Jeffery G | $112,000 | Stewart Title Guaranty Compa | |
| Customized Performance Solutions Inc | $88,000 | Chelsea Title Agency Of Dayt |
Source: Public Records
Mortgage History
| Date | Status | Borrower | Loan Amount |
|---|---|---|---|
| Previous Owner | Richmond Jeffery G | $100,800 | |
| Previous Owner | Customized Performance Solutions Inc | $64,500 |
Source: Public Records
Tax History Compared to Growth
Tax History
| Year | Tax Paid | Tax Assessment Tax Assessment Total Assessment is a certain percentage of the fair market value that is determined by local assessors to be the total taxable value of land and additions on the property. | Land | Improvement |
|---|---|---|---|---|
| 2024 | $3,001 | $56,880 | $10,010 | $46,870 |
| 2023 | $3,001 | $56,880 | $10,010 | $46,870 |
| 2022 | $2,665 | $39,740 | $7,000 | $32,740 |
| 2021 | $2,698 | $39,740 | $7,000 | $32,740 |
| 2020 | $2,700 | $39,740 | $7,000 | $32,740 |
| 2019 | $2,850 | $37,140 | $7,000 | $30,140 |
| 2018 | $2,859 | $37,140 | $7,000 | $30,140 |
| 2017 | $2,842 | $37,140 | $7,000 | $30,140 |
| 2016 | $2,704 | $34,410 | $7,000 | $27,410 |
| 2015 | $2,670 | $34,410 | $7,000 | $27,410 |
| 2014 | $2,670 | $34,410 | $7,000 | $27,410 |
| 2012 | -- | $34,350 | $8,750 | $25,600 |
Source: Public Records
Map
Nearby Homes
- 4407 Nowak Ave
- 4470 Mahler Dr
- 4364 Leston Ave
- 4608 Nowak Ave
- 4440 Longfellow Ave
- 5433 Pentland Cir
- 5365 Mariner Dr
- 5059 Key West Dr
- 5660 Tomberg St
- 5720 Old Troy Pike
- 4093 Vitek Dr Unit 4093
- 4309 Kitridge Rd
- 4488 Northern Cir
- 5669 Traymore Dr
- 5560 Harshmanville Rd
- 4640 Wayne Meadows Cir
- 4646 Wayne Meadows Cir Unit 4640
- 5784 Pennywell Dr
- 5431 Naughton Dr
- 4848 Rittenhouse Dr
- 5242 Pitcairn Rd
- 5234 Pitcairn Rd
- 4391 Mozart Ave
- 4401 Mozart Ave
- 4401 Mozart Ave Unit 1
- 4381 Mozart Ave
- 5246 Pitcairn Rd
- 5230 Pitcairn Rd
- 5239 Pitcairn Rd
- 5235 Pitcairn Rd
- 4411 Mozart Ave
- 5243 Pitcairn Rd
- 4371 Mozart Ave
- 5231 Pitcairn Rd
- 5250 Pitcairn Rd
- 5226 Pitcairn Rd
- 5247 Pitcairn Rd
- 4421 Mozart Ave
- 5227 Pitcairn Rd
- 4361 Mozart Ave