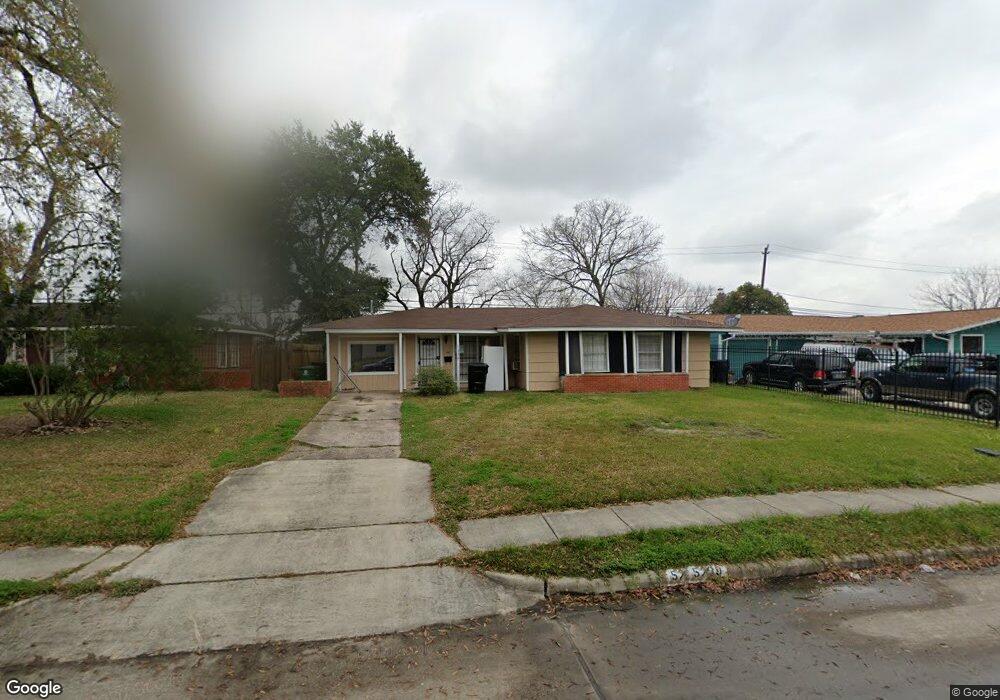
5239 Browncroft St Houston, TX 77021
OST-South Union NeighborhoodEstimated Value: $164,088 - $197,000
3
Beds
1
Bath
1,425
Sq Ft
$132/Sq Ft
Est. Value
About This Home
This home is located at 5239 Browncroft St, Houston, TX 77021 and is currently estimated at $187,772, approximately $131 per square foot. 5239 Browncroft St is a home located in Harris County with nearby schools including Hartsfield Elementary Animal and Environmental Sciences Magnet, Cullen Middle School, and Yates High School.
Ownership History
Date
Name
Owned For
Owner Type
Purchase Details
Closed on
Nov 10, 2021
Sold by
Laquisa Grant Dominique
Bought by
Grant Duval Anthony and Chung-Grant Suzette Judith
Current Estimated Value
Purchase Details
Closed on
Jun 6, 2017
Sold by
Grant Duval and Grant Suzette
Bought by
Grant Dominique Laquisa
Purchase Details
Closed on
Sep 2, 2016
Sold by
Red Star Homes Gp
Bought by
Grant Suzette Chung
Home Financials for this Owner
Home Financials are based on the most recent Mortgage that was taken out on this home.
Original Mortgage
$22,700
Interest Rate
3.46%
Purchase Details
Closed on
Aug 14, 2013
Sold by
Ferguson Clinton Lee
Bought by
Grant Duval A and Grant Suzette
Purchase Details
Closed on
Jan 31, 2013
Sold by
Ferguson Cinton
Bought by
Grant Suzette Chung
Create a Home Valuation Report for This Property
The Home Valuation Report is an in-depth analysis detailing your home's value as well as a comparison with similar homes in the area
Home Values in the Area
Average Home Value in this Area
Purchase History
| Date | Buyer | Sale Price | Title Company |
|---|---|---|---|
| Grant Duval Anthony | -- | None Listed On Document | |
| Grant Dominique Laquisa | -- | None Available | |
| Grant Suzette Chung | -- | -- | |
| Grant Duval A | -- | None Available | |
| Grant Suzette Chung | -- | None Available |
Source: Public Records
Mortgage History
| Date | Status | Borrower | Loan Amount |
|---|---|---|---|
| Previous Owner | Grant Suzette Chung | $22,700 | |
| Previous Owner | Grant Suzette Chung | -- |
Source: Public Records
Tax History Compared to Growth
Tax History
| Year | Tax Paid | Tax Assessment Tax Assessment Total Assessment is a certain percentage of the fair market value that is determined by local assessors to be the total taxable value of land and additions on the property. | Land | Improvement |
|---|---|---|---|---|
| 2025 | $2,847 | $124,476 | $74,958 | $49,518 |
| 2024 | $2,847 | $136,063 | $74,958 | $61,105 |
| 2023 | $2,847 | $134,316 | $74,958 | $59,358 |
| 2022 | $2,755 | $118,928 | $68,712 | $50,216 |
| 2021 | $2,542 | $109,074 | $49,972 | $59,102 |
| 2020 | $2,155 | $84,948 | $31,233 | $53,715 |
| 2019 | $1,969 | $74,424 | $26,548 | $47,876 |
| 2018 | $1,492 | $58,974 | $18,740 | $40,234 |
| 2017 | $1,559 | $58,974 | $18,740 | $40,234 |
| 2016 | $1,559 | $58,974 | $18,740 | $40,234 |
| 2015 | $1,380 | $58,974 | $18,740 | $40,234 |
| 2014 | $1,380 | $53,675 | $15,616 | $38,059 |
Source: Public Records
Map
Nearby Homes
- 5215 Kingsbury St
- 5251 Dewberry St
- 5224 Dewberry St
- 5338 Keystone St
- 5322 Dewberry St
- 5251 Perry St
- 5259 Perry St
- 6031 Beekman Rd
- 5219 Cosby St
- 4611 Dewberry St
- 5151 Martin Luther King Blvd
- 5503-5515 Griggs Rd
- 5210 Enyart St
- 5166 Oasis Park
- 5142 Oasis Park
- 5111 Cosby St
- 5244 Enyart St
- 5714 Sunrise Rd
- 5706 Milart St
- 5102 Cortelyou Ln
- 5233 Browncroft St
- 5243 Browncroft St
- 5229 Browncroft St
- 5247 Browncroft St
- 5238 Browncroft St
- 5225 Browncroft St
- 5242 Browncroft St
- 5230 Browncroft St
- 5251 Browncroft St
- 5246 Browncroft St
- 5226 Browncroft St
- 5221 Browncroft St
- 5222 Browncroft St
- 5239 Kingsbury St
- 5235 Kingsbury St
- 5243 Kingsbury St
- 5215 Browncroft St
- 5247 Kingsbury St
- 5218 Browncroft St
- 5227 Kingsbury St