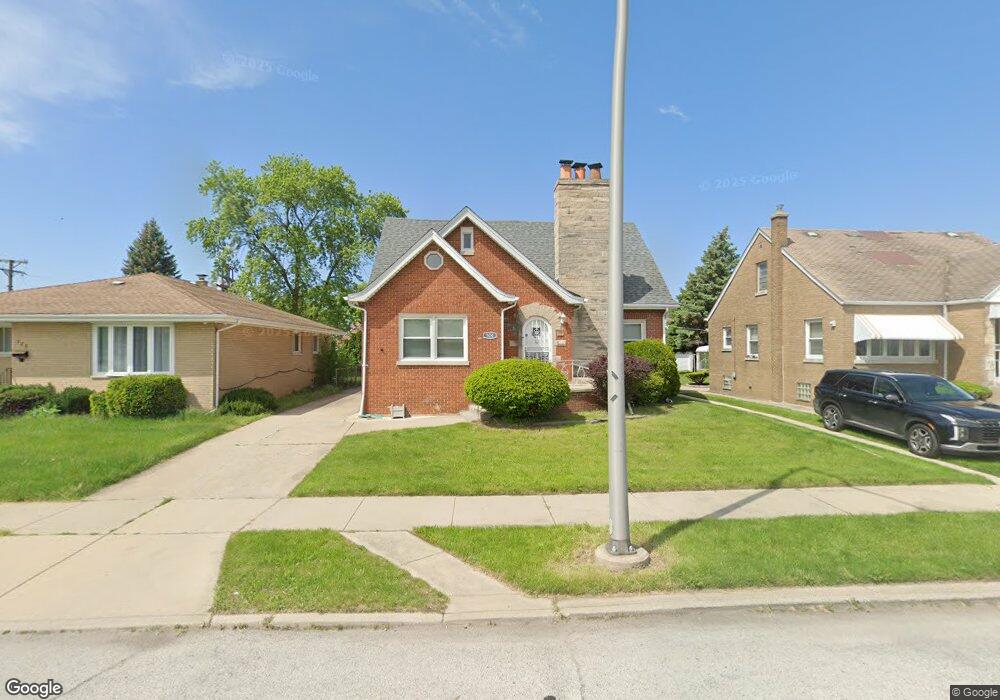
524 157th St Calumet City, IL 60409
Estimated Value: $169,000 - $204,000
3
Beds
2
Baths
1,215
Sq Ft
$151/Sq Ft
Est. Value
About This Home
This home is located at 524 157th St, Calumet City, IL 60409 and is currently estimated at $183,391, approximately $150 per square foot. 524 157th St is a home located in Cook County with nearby schools including Lincoln Elementary School, Thornton Fractional North High School, and Hammond Academy Of Science & Tech.
Ownership History
Date
Name
Owned For
Owner Type
Purchase Details
Closed on
Feb 26, 2021
Sold by
Illinois Reo Sales Inc
Bought by
Briggs Alexandria J
Current Estimated Value
Purchase Details
Closed on
Jan 25, 2019
Sold by
Cunningham Latanya
Bought by
Illinois Reo Sales Inc
Purchase Details
Closed on
Dec 18, 2002
Sold by
Deboer Lawrence J and Deboer Rochelle A
Bought by
Cunningham Johnny and Cunningham Latanya
Home Financials for this Owner
Home Financials are based on the most recent Mortgage that was taken out on this home.
Original Mortgage
$129,000
Interest Rate
6.99%
Create a Home Valuation Report for This Property
The Home Valuation Report is an in-depth analysis detailing your home's value as well as a comparison with similar homes in the area
Home Values in the Area
Average Home Value in this Area
Purchase History
| Date | Buyer | Sale Price | Title Company |
|---|---|---|---|
| Briggs Alexandria J | $188,000 | -- | |
| Briggs Alexandria J | $188,000 | -- | |
| Illinois Reo Sales Inc | $20,000 | None Available | |
| Cunningham Johnny | $129,000 | Chicago Title Insurance Co |
Source: Public Records
Mortgage History
| Date | Status | Borrower | Loan Amount |
|---|---|---|---|
| Previous Owner | Cunningham Johnny | $129,000 |
Source: Public Records
Tax History Compared to Growth
Tax History
| Year | Tax Paid | Tax Assessment Tax Assessment Total Assessment is a certain percentage of the fair market value that is determined by local assessors to be the total taxable value of land and additions on the property. | Land | Improvement |
|---|---|---|---|---|
| 2024 | $3,186 | $5,761 | $1,220 | $4,541 |
| 2023 | $2,622 | $5,761 | $1,220 | $4,541 |
| 2022 | $2,622 | $3,624 | $1,068 | $2,556 |
| 2021 | $2,676 | $3,622 | $1,067 | $2,555 |
| 2020 | $2,495 | $3,622 | $1,067 | $2,555 |
| 2019 | $2,235 | $4,566 | $991 | $3,575 |
| 2018 | $2,201 | $4,566 | $991 | $3,575 |
| 2017 | $2,139 | $4,566 | $991 | $3,575 |
| 2016 | $2,117 | $4,348 | $915 | $3,433 |
| 2015 | $2,010 | $4,348 | $915 | $3,433 |
| 2014 | $2,023 | $4,348 | $915 | $3,433 |
| 2013 | $2,139 | $4,907 | $915 | $3,992 |
Source: Public Records
Map
Nearby Homes