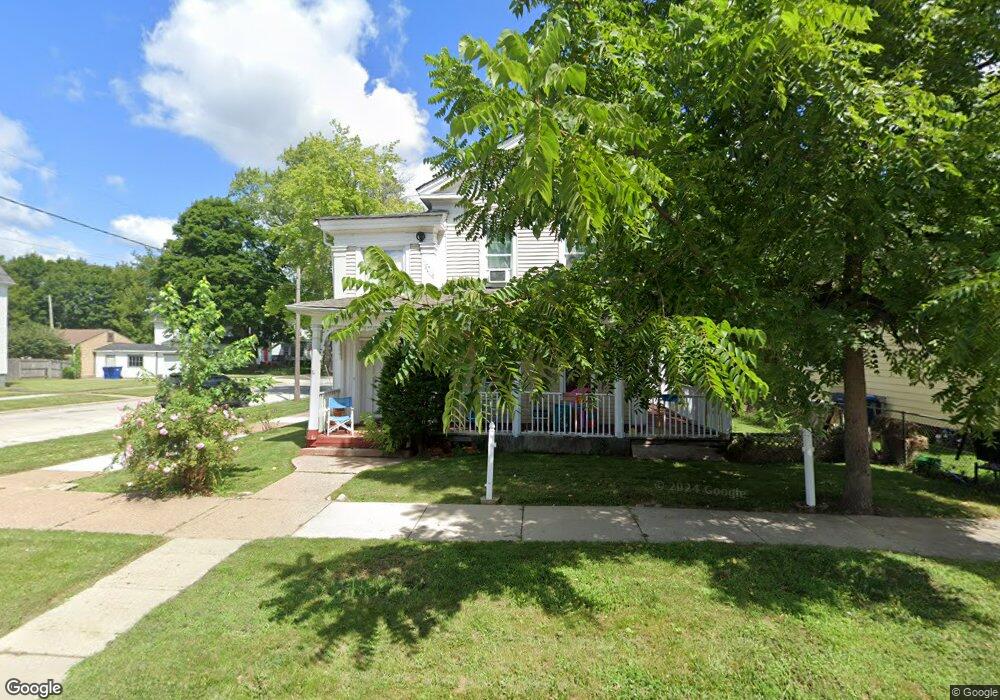
524 2nd St Waukegan, IL 60085
Estimated Value: $283,753 - $325,000
4
Beds
2
Baths
2,850
Sq Ft
$107/Sq Ft
Est. Value
About This Home
This home is located at 524 2nd St, Waukegan, IL 60085 and is currently estimated at $305,188, approximately $107 per square foot. 524 2nd St is a home located in Lake County with nearby schools including Edith M Smith Middle School, Waukegan High School, and Most Blessed Trinity Academy.
Ownership History
Date
Name
Owned For
Owner Type
Purchase Details
Closed on
Nov 5, 2009
Sold by
Carrillo Mayte
Bought by
650 Mcalister Llc
Current Estimated Value
Purchase Details
Closed on
Aug 22, 2006
Sold by
Carrillo Marco A and Carrillo Mayte
Bought by
Carrillo Mayte
Purchase Details
Closed on
May 25, 2001
Sold by
Mendez Pastor and Mendez Maria
Bought by
Carrillo Marco A and Carrillo Mayte
Home Financials for this Owner
Home Financials are based on the most recent Mortgage that was taken out on this home.
Original Mortgage
$115,192
Interest Rate
7.2%
Mortgage Type
FHA
Purchase Details
Closed on
Nov 29, 2000
Sold by
Mendez Pastor
Bought by
Mendez Pastor and Mendez Maria
Home Financials for this Owner
Home Financials are based on the most recent Mortgage that was taken out on this home.
Original Mortgage
$35,000
Interest Rate
7.86%
Create a Home Valuation Report for This Property
The Home Valuation Report is an in-depth analysis detailing your home's value as well as a comparison with similar homes in the area
Home Values in the Area
Average Home Value in this Area
Purchase History
| Date | Buyer | Sale Price | Title Company |
|---|---|---|---|
| 650 Mcalister Llc | $52,000 | Attorneys Title Guaranty Fun | |
| Carrillo Mayte | -- | None Available | |
| Carrillo Marco A | $117,000 | -- | |
| Mendez Pastor | -- | -- |
Source: Public Records
Mortgage History
| Date | Status | Borrower | Loan Amount |
|---|---|---|---|
| Previous Owner | Carrillo Marco A | $115,192 | |
| Previous Owner | Mendez Pastor | $35,000 |
Source: Public Records
Tax History Compared to Growth
Tax History
| Year | Tax Paid | Tax Assessment Tax Assessment Total Assessment is a certain percentage of the fair market value that is determined by local assessors to be the total taxable value of land and additions on the property. | Land | Improvement |
|---|---|---|---|---|
| 2024 | $7,592 | $89,334 | $7,494 | $81,840 |
| 2023 | $7,156 | $80,518 | $6,709 | $73,809 |
| 2022 | $7,156 | $73,202 | $6,381 | $66,821 |
| 2021 | $6,570 | $63,014 | $5,692 | $57,322 |
| 2020 | $6,655 | $58,705 | $5,303 | $53,402 |
| 2019 | $6,697 | $53,793 | $4,859 | $48,934 |
| 2018 | $6,096 | $47,152 | $6,191 | $40,961 |
| 2017 | $5,934 | $41,716 | $5,477 | $36,239 |
| 2016 | $5,602 | $36,249 | $4,759 | $31,490 |
| 2015 | $5,480 | $32,443 | $4,259 | $28,184 |
| 2014 | $4,029 | $23,813 | $3,833 | $19,980 |
| 2012 | $4,815 | $25,800 | $4,153 | $21,647 |
Source: Public Records
Map
Nearby Homes
- 452 North Ave
- 428 N Poplar St
- 522 N Poplar St
- 702 Franklin St
- 511 Chestnut St
- 620 N Poplar St
- 325 4th St
- 723 N County St
- 611 N Genesee St
- 222 Grand Ave
- 918 N Ash St
- 415 W Ridgeland Ave
- 28 N Saint James St
- 1109 Massena Ave
- 917 N Linden Ave
- 509 N Butrick St
- 1110 N Ash St
- 1122 N Ash St
- 613 Washington St
- 217 Stewart Ave