524 Earls Rd Baltimore, MD 21220
Estimated Value: $16,460,678
Studio
1
Bath
1,024
Sq Ft
$16,075/Sq Ft
Est. Value
About This Home
This home is located at 524 Earls Rd, Baltimore, MD 21220 and is currently estimated at $16,460,678, approximately $16,074 per square foot. 524 Earls Rd is a home located in Baltimore County with nearby schools including Vincent Farm Elementary, Middle River Middle School, and Perry Hall High School.
Ownership History
Date
Name
Owned For
Owner Type
Purchase Details
Closed on
Oct 4, 2022
Sold by
Bc Benhoff Parcel Llc
Bought by
Bc Area 2 Lot 9 Llc
Current Estimated Value
Purchase Details
Closed on
Aug 15, 2022
Sold by
Bc Area 2 Lot 9 Llc
Bought by
Gl Development Lc
Purchase Details
Closed on
Jun 1, 2016
Sold by
Bc Area 2 Lot 1 Llc
Bought by
Greenleigh I Investments Lc
Home Financials for this Owner
Home Financials are based on the most recent Mortgage that was taken out on this home.
Original Mortgage
$34,000,000
Interest Rate
3.61%
Mortgage Type
Commercial
Purchase Details
Closed on
Apr 20, 2012
Sold by
Northpoint Holding Enterprises Inc
Bought by
Bc Benhoff Parcel Llc
Purchase Details
Closed on
Aug 28, 1986
Sold by
Pen-Mar Company Inc
Bought by
Norpoint Holding Enterprises Inc
Create a Home Valuation Report for This Property
The Home Valuation Report is an in-depth analysis detailing your home's value as well as a comparison with similar homes in the area
Home Values in the Area
Average Home Value in this Area
Purchase History
| Date | Buyer | Sale Price | Title Company |
|---|---|---|---|
| Bc Area 2 Lot 9 Llc | -- | First American Title | |
| Bc Area 2 Lot 9 Llc | -- | First American Title | |
| Gl Development Lc | $14,655,817 | Fenton Title | |
| Greenleigh I Investments Lc | $13,659,182 | Residential Title & Escrow C | |
| Bc Benhoff Parcel Llc | $1,800,000 | Residential Title & Escrow C | |
| Norpoint Holding Enterprises Inc | $200,000 | -- |
Source: Public Records
Mortgage History
| Date | Status | Borrower | Loan Amount |
|---|---|---|---|
| Previous Owner | Greenleigh I Investments Lc | $34,000,000 |
Source: Public Records
Tax History
| Year | Tax Paid | Tax Assessment Tax Assessment Total Assessment is a certain percentage of the fair market value that is determined by local assessors to be the total taxable value of land and additions on the property. | Land | Improvement |
|---|---|---|---|---|
| 2025 | $28,165 | $2,334,400 | $2,334,400 | -- |
| 2024 | $28,165 | $2,334,400 | $2,334,400 | $0 |
| 2023 | $14,147 | $2,334,400 | $2,334,400 | $0 |
| 2022 | $25,398 | $2,114,700 | $2,114,700 | $0 |
| 2021 | $25,398 | $2,114,700 | $2,114,700 | $0 |
| 2020 | $25,690 | $2,114,700 | $2,114,700 | $0 |
| 2019 | $25,630 | $2,114,700 | $2,114,700 | $0 |
| 2018 | $25,458 | $2,114,700 | $2,114,700 | $0 |
| 2017 | $22,297 | $2,499,200 | $0 | $0 |
| 2016 | $15,200 | $1,743,333 | $0 | $0 |
| 2015 | $15,200 | $1,516,667 | $0 | $0 |
| 2014 | $15,200 | $1,170,000 | $0 | $0 |
Source: Public Records
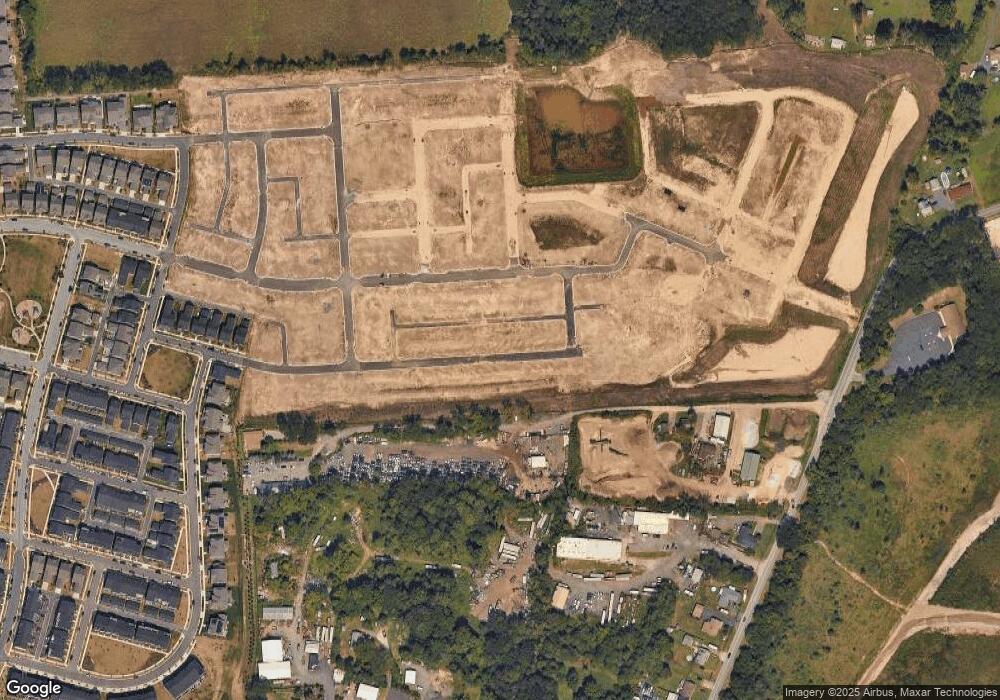
Map
Nearby Homes
- 6632 Camden St
- 6634 Camden St
- 6628 Camden St
- 6642 Camden St
- 6623 Greenleigh Ave
- 6621 Greenleigh Ave
- 6620 Camden St
- 6619 Greenleigh Ave
- 603 Harrington St
- 505 Willowshire St
- 6606 Greenleigh Ave
- 6604 Greenleigh Ave
- 6707 Greenleigh Ave
- 6602 Greenleigh Ave
- 6711 Greenleigh Ave
- 502 Willowshire St
- 6708 Camden St
- 504 Willowshire St
- 6710 Camden St
- HOMESITE 3C.0003 Greenleigh Ave
Your Personal Tour Guide
Ask me questions while you tour the home.