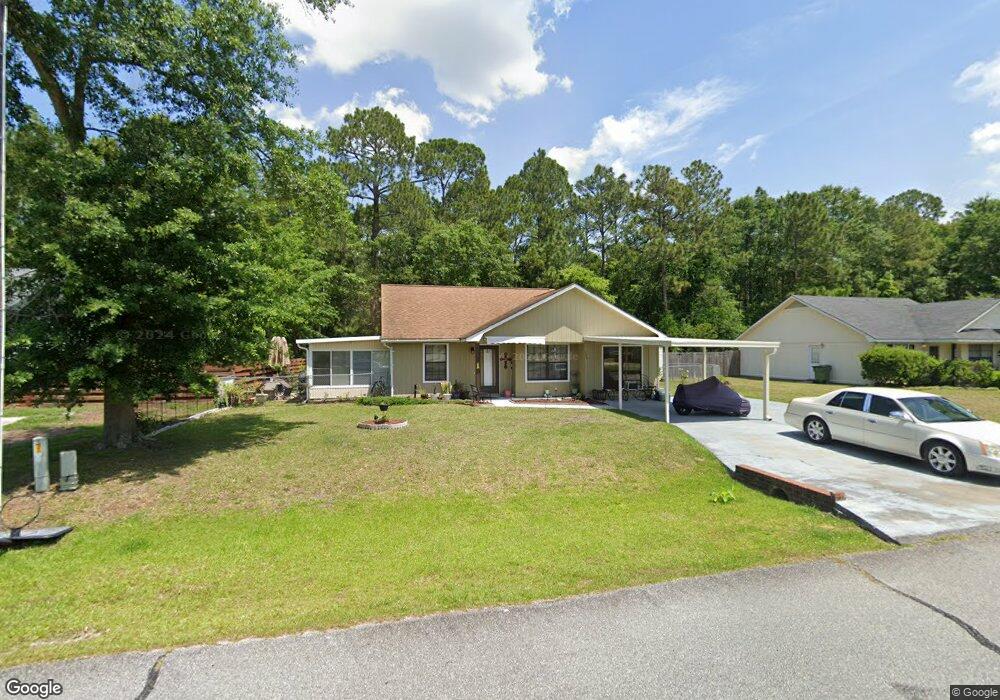
524 Elm St Hinesville, GA 31313
Estimated Value: $194,000 - $206,000
2
Beds
2
Baths
1,303
Sq Ft
$154/Sq Ft
Est. Value
About This Home
This home is located at 524 Elm St, Hinesville, GA 31313 and is currently estimated at $200,733, approximately $154 per square foot. 524 Elm St is a home located in Liberty County with nearby schools including Button Gwinnett Elementary School, Snelson-Golden Middle School, and Bradwell Institute.
Ownership History
Date
Name
Owned For
Owner Type
Purchase Details
Closed on
Jul 11, 1997
Sold by
Jones Arthur
Bought by
Parker James C
Current Estimated Value
Purchase Details
Closed on
Sep 3, 1996
Bought by
Secretary Of Veterans Affairs
Purchase Details
Closed on
Sep 21, 1988
Bought by
Jones Arthur L and Jones Kelly J
Purchase Details
Closed on
Mar 11, 1988
Bought by
Dryden Claude L
Purchase Details
Closed on
Jan 16, 1986
Bought by
Jerry Wheeler Enter
Create a Home Valuation Report for This Property
The Home Valuation Report is an in-depth analysis detailing your home's value as well as a comparison with similar homes in the area
Home Values in the Area
Average Home Value in this Area
Purchase History
| Date | Buyer | Sale Price | Title Company |
|---|---|---|---|
| Parker James C | $49,000 | -- | |
| Secretary Of Veterans Affairs | -- | -- | |
| Regions Mortgage Inc | -- | -- | |
| Jones Arthur L | $49,500 | -- | |
| Dryden Claude L | -- | -- | |
| Jerry Wheeler Enter | -- | -- |
Source: Public Records
Tax History Compared to Growth
Tax History
| Year | Tax Paid | Tax Assessment Tax Assessment Total Assessment is a certain percentage of the fair market value that is determined by local assessors to be the total taxable value of land and additions on the property. | Land | Improvement |
|---|---|---|---|---|
| 2024 | $2,548 | $65,810 | $14,000 | $51,810 |
| 2023 | $2,548 | $57,976 | $12,000 | $45,976 |
| 2022 | $1,980 | $46,271 | $9,200 | $37,071 |
| 2021 | $1,828 | $42,274 | $9,200 | $33,074 |
| 2020 | $1,797 | $41,284 | $9,200 | $32,084 |
| 2019 | $1,785 | $41,300 | $9,200 | $32,100 |
| 2018 | $1,797 | $41,741 | $9,200 | $32,541 |
| 2017 | $1,375 | $41,757 | $9,200 | $32,557 |
| 2016 | $1,737 | $42,198 | $9,200 | $32,998 |
| 2015 | $1,591 | $36,820 | $6,800 | $30,020 |
| 2014 | $1,591 | $38,034 | $8,800 | $29,234 |
| 2013 | -- | $36,779 | $8,800 | $27,979 |
Source: Public Records
Map
Nearby Homes