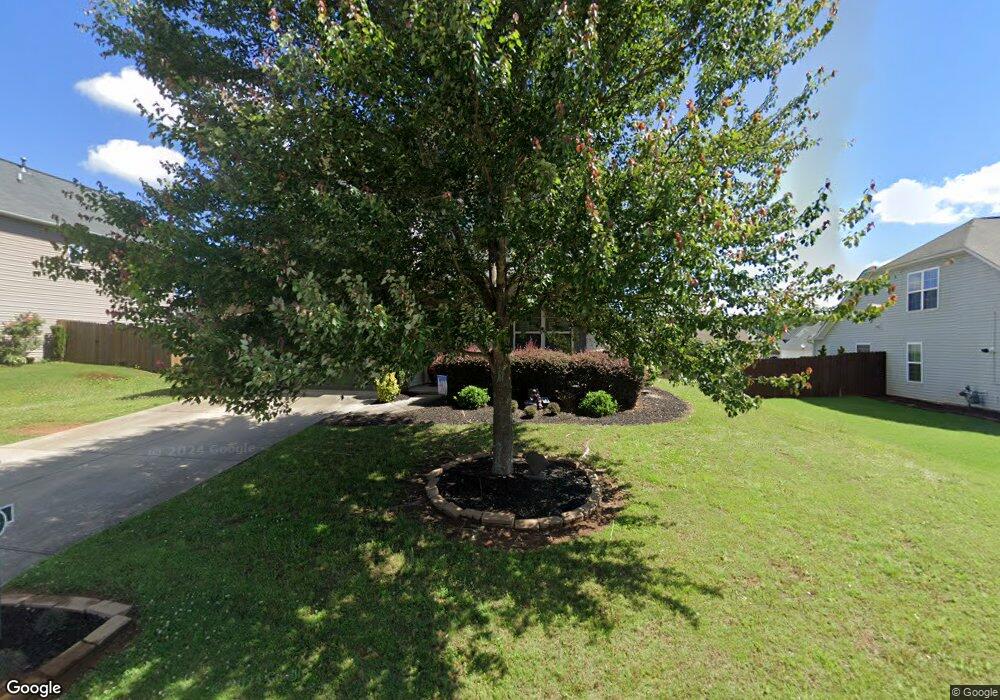
524 Goldstone Ln Boiling Springs, SC 29316
Estimated Value: $279,000 - $302,000
3
Beds
3
Baths
1,832
Sq Ft
$160/Sq Ft
Est. Value
About This Home
This home is located at 524 Goldstone Ln, Boiling Springs, SC 29316 and is currently estimated at $292,611, approximately $159 per square foot. 524 Goldstone Ln is a home with nearby schools including Boiling Springs Middle School and Boiling Springs High School.
Ownership History
Date
Name
Owned For
Owner Type
Purchase Details
Closed on
Apr 3, 2024
Sold by
Salters Melisa P and Salters Howard
Bought by
Salters Melisa P
Current Estimated Value
Purchase Details
Closed on
May 2, 2013
Sold by
Malone Mia
Bought by
Pridmore Ricky and Pridmore Ashley N
Home Financials for this Owner
Home Financials are based on the most recent Mortgage that was taken out on this home.
Original Mortgage
$158,346
Interest Rate
3.56%
Mortgage Type
New Conventional
Purchase Details
Closed on
Apr 30, 2013
Sold by
Mungo Homes Inc
Bought by
Salters Howard and Hampson Melisa Paige
Home Financials for this Owner
Home Financials are based on the most recent Mortgage that was taken out on this home.
Original Mortgage
$158,346
Interest Rate
3.56%
Mortgage Type
New Conventional
Purchase Details
Closed on
Jul 3, 2012
Sold by
Mark Iii Properties Inc
Bought by
Mungo Homes Inc
Purchase Details
Closed on
May 8, 2012
Sold by
Lazarus Shouse Communities Llc
Bought by
Mark Iii Properties Inc
Create a Home Valuation Report for This Property
The Home Valuation Report is an in-depth analysis detailing your home's value as well as a comparison with similar homes in the area
Home Values in the Area
Average Home Value in this Area
Purchase History
| Date | Buyer | Sale Price | Title Company |
|---|---|---|---|
| Salters Melisa P | -- | None Listed On Document | |
| Pridmore Ricky | $105,450 | -- | |
| Salters Howard | $155,180 | -- | |
| Mungo Homes Inc | $198,000 | -- | |
| Mark Iii Properties Inc | $1,616,588 | -- |
Source: Public Records
Mortgage History
| Date | Status | Borrower | Loan Amount |
|---|---|---|---|
| Previous Owner | Pridmore Ricky | $158,346 | |
| Previous Owner | Salters Howard | $158,346 |
Source: Public Records
Tax History Compared to Growth
Tax History
| Year | Tax Paid | Tax Assessment Tax Assessment Total Assessment is a certain percentage of the fair market value that is determined by local assessors to be the total taxable value of land and additions on the property. | Land | Improvement |
|---|---|---|---|---|
| 2025 | $1,390 | $8,204 | $1,280 | $6,924 |
| 2024 | $1,390 | $8,204 | $1,280 | $6,924 |
| 2023 | $1,390 | $8,204 | $1,280 | $6,924 |
| 2022 | $1,239 | $7,135 | $979 | $6,156 |
| 2021 | $1,237 | $7,135 | $979 | $6,156 |
| 2020 | $1,219 | $7,135 | $979 | $6,156 |
| 2019 | $1,219 | $7,135 | $979 | $6,156 |
| 2018 | $1,191 | $7,135 | $979 | $6,156 |
| 2017 | $1,047 | $6,204 | $1,000 | $5,204 |
| 2016 | $1,053 | $6,204 | $1,000 | $5,204 |
| 2015 | $1,050 | $6,204 | $1,000 | $5,204 |
| 2014 | $1,037 | $6,204 | $1,000 | $5,204 |
Source: Public Records
Map
Nearby Homes
- 695 Flintrock Dr
- 370 Slate Dr
- 669 Flintrock Dr
- 325 Marble Ln
- Aruba Bay Plan at Millwood Ranches
- Dominica Spring Plan at Millwood Ranches
- Grand Bahama Plan at Millwood Ranches
- Grand Cayman Plan at Millwood Ranches
- 3009 Stonemill Trail
- 479 Slate Dr
- 711 Burbrook Ln
- 5005 Atkins Way
- 5001 Atkins Way
- 627 Secretariat Dr
- 5006 Atkins Way
- Liston Plan at Sparrow Creek - Reserve
- Valen Plan at Sparrow Creek - Summit
- Winthrop Plan at Sparrow Creek - Summit
- Heston Plan at Sparrow Creek - Summit
- Frazier Plan at Sparrow Creek - Reserve
- 518 Goldstone Ln Unit Boiling Springs
- 518 Goldstone Ln
- 530 Goldstone Ln
- 913 Rip Rap Dr
- 907 Rip Rap Dr
- 919 Rip Rap Dr
- 510 Goldstone Ln
- 523 Goldstone Ln
- 517 Goldstone Ln
- 529 Goldstone Ln
- 212 Slate Dr
- 925 Rip Rap Dr
- 901 Rip Rap Dr
- 535 Goldstone Ln
- 511 Goldstone Ln
- 542 Goldstone Ln
- 226 Slate Dr
- 931 Rip Rap Dr
- 541 Goldstone Ln
- 505 Goldstone Ln