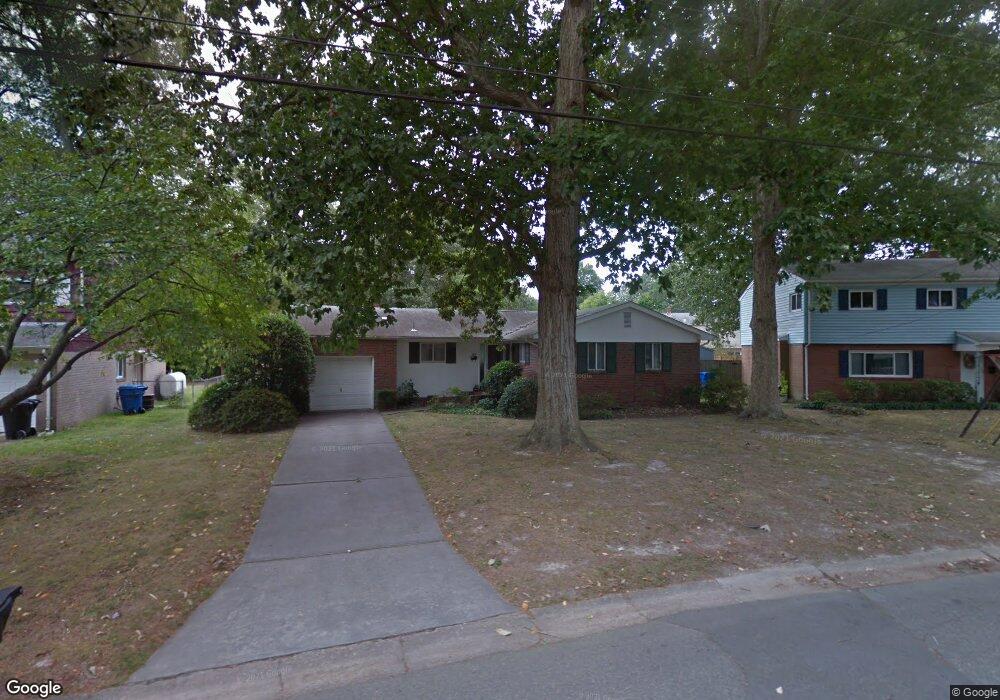
524 Hornell Ln Virginia Beach, VA 23452
Little Neck NeighborhoodEstimated Value: $389,000 - $413,000
3
Beds
2
Baths
1,320
Sq Ft
$307/Sq Ft
Est. Value
About This Home
This home is located at 524 Hornell Ln, Virginia Beach, VA 23452 and is currently estimated at $405,692, approximately $307 per square foot. 524 Hornell Ln is a home located in Virginia Beach City with nearby schools including Thalia Elementary School, Independence Middle School, and Princess Anne High School.
Ownership History
Date
Name
Owned For
Owner Type
Purchase Details
Closed on
Jan 13, 2021
Sold by
Newell Seth L
Bought by
Kurtzner William and Kurtzner Yvonne J
Current Estimated Value
Home Financials for this Owner
Home Financials are based on the most recent Mortgage that was taken out on this home.
Original Mortgage
$198,000
Outstanding Balance
$176,716
Interest Rate
2.71%
Mortgage Type
New Conventional
Estimated Equity
$228,976
Purchase Details
Closed on
Jan 14, 2019
Sold by
The Secretary Of Hud
Bought by
Newell Seth L
Home Financials for this Owner
Home Financials are based on the most recent Mortgage that was taken out on this home.
Original Mortgage
$237,616
Interest Rate
5.12%
Mortgage Type
FHA
Purchase Details
Closed on
Aug 27, 2018
Sold by
Sheffield Pamela N and Neal Jeffrey Alan
Bought by
Secretary Of Hud
Create a Home Valuation Report for This Property
The Home Valuation Report is an in-depth analysis detailing your home's value as well as a comparison with similar homes in the area
Home Values in the Area
Average Home Value in this Area
Purchase History
| Date | Buyer | Sale Price | Title Company |
|---|---|---|---|
| Kurtzner William | $285,000 | Equity Title | |
| Newell Seth L | $242,000 | Fidelity National Title | |
| Secretary Of Hud | $171,523 | National Commerical Services |
Source: Public Records
Mortgage History
| Date | Status | Borrower | Loan Amount |
|---|---|---|---|
| Open | Kurtzner William | $198,000 | |
| Previous Owner | Newell Seth L | $237,616 |
Source: Public Records
Tax History Compared to Growth
Tax History
| Year | Tax Paid | Tax Assessment Tax Assessment Total Assessment is a certain percentage of the fair market value that is determined by local assessors to be the total taxable value of land and additions on the property. | Land | Improvement |
|---|---|---|---|---|
| 2025 | $3,428 | $359,500 | $180,000 | $179,500 |
| 2024 | $3,428 | $353,400 | $180,000 | $173,400 |
| 2023 | $3,023 | $305,400 | $140,000 | $165,400 |
| 2022 | $2,799 | $282,700 | $120,000 | $162,700 |
| 2021 | $2,114 | $213,500 | $92,000 | $121,500 |
| 2020 | $2,231 | $219,300 | $92,000 | $127,300 |
| 2019 | $2,265 | $221,600 | $92,000 | $129,600 |
| 2018 | $2,222 | $221,600 | $92,000 | $129,600 |
| 2017 | $2,131 | $212,600 | $83,000 | $129,600 |
| 2016 | -- | $203,500 | $82,600 | $120,900 |
| 2015 | -- | $192,800 | $82,600 | $110,200 |
| 2014 | -- | $209,100 | $126,000 | $83,100 |
Source: Public Records
Map
Nearby Homes
- 505 Holbrook Rd
- 508 Kirkwood Ln
- 3903 Wyckoff Dr
- 748 Pinetree Dr
- 624 Piney Point Rd
- 4205 Woodport Cir
- 409 Cronin Rd
- 452 Thalia Rd
- 505 Edinburgh Place
- 604 Robens Rd
- 608 Thalia Rd
- 609 Thalia Point Rd
- 409 Cedar Ln
- 3716 Virginius Dr
- 4178 Thalia Station Cir
- 211 Thalia Rd
- 3629 Virginius Dr
- 675 Thalia Point Rd
- 119 S Boggs Ave
- 3928 Regal Ct
- 528 Hornell Ln
- 520 Hornell Ln
- 529 Holbrook Rd
- 533 Holbrook Rd
- 525 Holbrook Rd
- 532 Hornell Ln
- 532 Hornell Ln Unit Ln
- 517 Hornell Ln
- 516 Hornell Ln
- 537 Holbrook Rd
- 521 Holbrook Rd
- 516 Kirkwood Ln
- 513 Hornell Ln
- 517 Holbrook Rd
- 536 Hornell Ln
- 512 Hornell Ln
- 541 Holbrook Rd
- 512 Kirkwood Ln
- 536 Holbrook Rd
- 532 Holbrook Rd