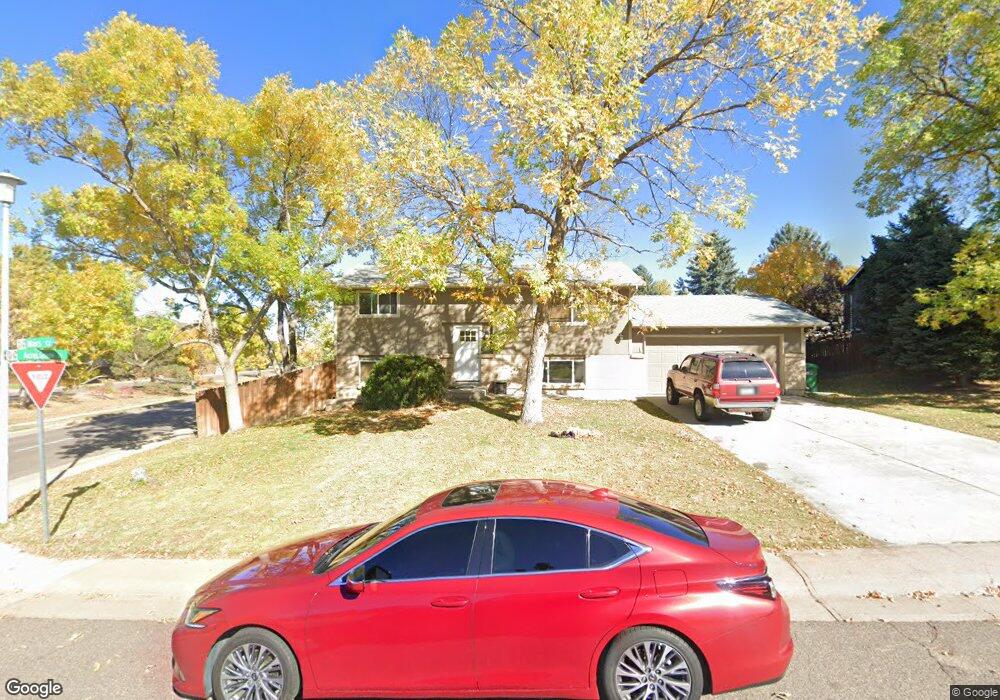
524 Mars Ct Lone Tree, CO 80124
Estimated Value: $559,914 - $606,000
4
Beds
2
Baths
1,764
Sq Ft
$330/Sq Ft
Est. Value
About This Home
This home is located at 524 Mars Ct, Lone Tree, CO 80124 and is currently estimated at $582,957, approximately $330 per square foot. 524 Mars Ct is a home located in Douglas County with nearby schools including Acres Green Elementary School, Cresthill Middle School, and Highlands Ranch High School.
Ownership History
Date
Name
Owned For
Owner Type
Purchase Details
Closed on
May 7, 2021
Sold by
Oxfordshire Quarters Llc
Bought by
Guiry Patrick
Current Estimated Value
Home Financials for this Owner
Home Financials are based on the most recent Mortgage that was taken out on this home.
Original Mortgage
$345,000
Outstanding Balance
$312,656
Interest Rate
3.1%
Mortgage Type
New Conventional
Estimated Equity
$270,301
Purchase Details
Closed on
Apr 7, 2017
Sold by
The John N Patton Living Trust
Bought by
Oxfordshire Quarters Llc
Home Financials for this Owner
Home Financials are based on the most recent Mortgage that was taken out on this home.
Original Mortgage
$300,000
Interest Rate
5.37%
Mortgage Type
Adjustable Rate Mortgage/ARM
Purchase Details
Closed on
Feb 18, 2010
Sold by
Patton John N
Bought by
Patton John N
Purchase Details
Closed on
Oct 9, 1975
Sold by
Morris General Contractors Inc
Bought by
Patton John N
Create a Home Valuation Report for This Property
The Home Valuation Report is an in-depth analysis detailing your home's value as well as a comparison with similar homes in the area
Home Values in the Area
Average Home Value in this Area
Purchase History
| Date | Buyer | Sale Price | Title Company |
|---|---|---|---|
| Guiry Patrick | -- | Land Title Guarantee Company | |
| Oxfordshire Quarters Llc | $375,000 | First Integrity Title | |
| Patton John N | -- | None Available | |
| Patton John N | $32,000 | -- |
Source: Public Records
Mortgage History
| Date | Status | Borrower | Loan Amount |
|---|---|---|---|
| Open | Guiry Patrick | $345,000 | |
| Previous Owner | Oxfordshire Quarters Llc | $300,000 |
Source: Public Records
Tax History Compared to Growth
Tax History
| Year | Tax Paid | Tax Assessment Tax Assessment Total Assessment is a certain percentage of the fair market value that is determined by local assessors to be the total taxable value of land and additions on the property. | Land | Improvement |
|---|---|---|---|---|
| 2024 | $3,982 | $42,790 | $8,090 | $34,700 |
| 2023 | $4,100 | $42,790 | $8,090 | $34,700 |
| 2022 | $3,024 | $30,150 | $6,870 | $23,280 |
| 2021 | $3,125 | $30,150 | $6,870 | $23,280 |
| 2020 | $2,952 | $29,200 | $6,570 | $22,630 |
| 2019 | $3,275 | $29,200 | $6,570 | $22,630 |
| 2018 | $2,039 | $24,080 | $5,710 | $18,370 |
| 2017 | $1,453 | $24,080 | $5,710 | $18,370 |
| 2016 | $1,221 | $21,840 | $4,130 | $17,710 |
| 2015 | $981 | $21,840 | $4,130 | $17,710 |
| 2014 | $899 | $18,730 | $3,980 | $14,750 |
Source: Public Records
Map
Nearby Homes
- 13542 Achilles Dr
- 802 Altair Dr
- 13483 Achilles Dr
- 181 Dianna Dr
- 7920 E Phillips Cir
- 108 Olympus Cir
- 13134 Deneb Dr
- 130 Dianna Dr
- 13117 Deneb Dr
- 789 Hamal Dr
- 8170 S Tamarac St
- 7057 Chestnut Hill St
- 7041 Chestnut Hill Trail
- 8159 Lodgepole Trail
- 8059 S Quince Cir
- 6887 Chestnut Hill St
- 8860 Kachina Way
- 7933 S Trenton St
- 8822 Fiesta Terrace
- 9275 Erminedale Dr