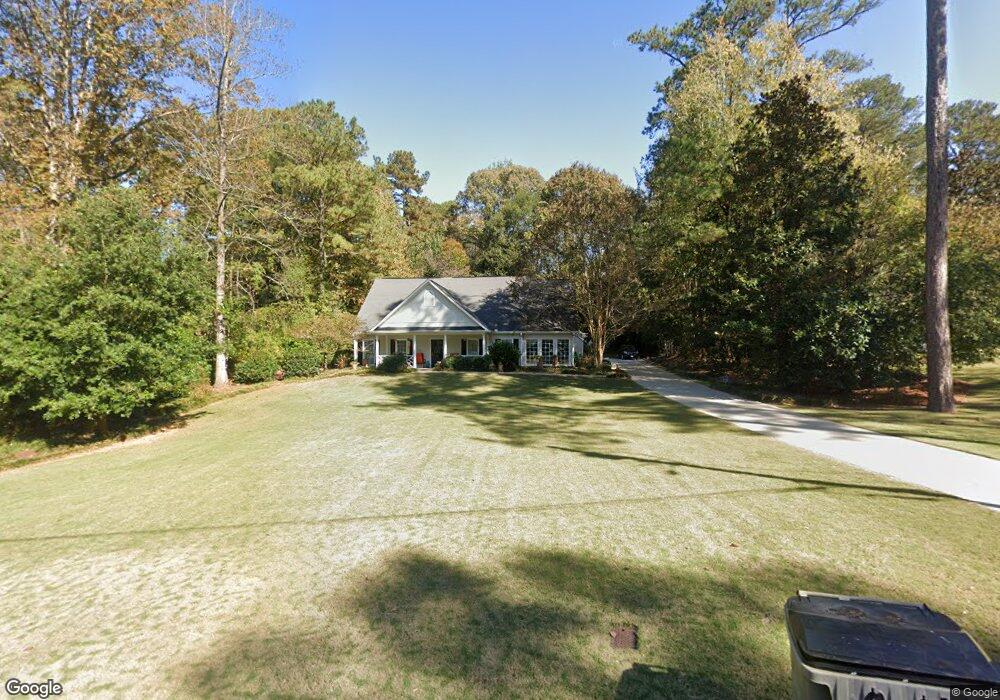
524 Ridgecrest Rd Lagrange, GA 30240
Estimated Value: $381,876 - $476,000
4
Beds
3
Baths
2,868
Sq Ft
$152/Sq Ft
Est. Value
About This Home
This home is located at 524 Ridgecrest Rd, Lagrange, GA 30240 and is currently estimated at $435,969, approximately $152 per square foot. 524 Ridgecrest Rd is a home located in Troup County with nearby schools including Hollis Hand Elementary School, Ethel W. Kight Elementary School, and Franklin Forest Elementary School.
Ownership History
Date
Name
Owned For
Owner Type
Purchase Details
Closed on
Nov 3, 2001
Sold by
Susan K Johnson Black
Bought by
Black Susan K and Black William B
Current Estimated Value
Purchase Details
Closed on
Jun 17, 1998
Sold by
Cody Averett
Bought by
Susan K Johnson Black
Purchase Details
Closed on
May 6, 1997
Sold by
James J Nixon
Bought by
Cody Averett
Purchase Details
Closed on
Aug 9, 1994
Sold by
George W Kish
Bought by
James J Nixon
Purchase Details
Closed on
Jul 1, 1986
Sold by
Ben H Parham Inc
Bought by
George W Kish
Purchase Details
Closed on
Oct 1, 1981
Sold by
Lancaster B A
Bought by
Ben H Parham Inc
Purchase Details
Closed on
Jan 1, 1955
Sold by
Lane Family Inc
Bought by
Lancaster B A
Create a Home Valuation Report for This Property
The Home Valuation Report is an in-depth analysis detailing your home's value as well as a comparison with similar homes in the area
Purchase History
| Date | Buyer | Sale Price | Title Company |
|---|---|---|---|
| Black Susan K | -- | -- | |
| Susan K Johnson Black | $215,000 | -- | |
| Cody Averett | $28,000 | -- | |
| James J Nixon | $32,000 | -- | |
| George W Kish | $29,000 | -- | |
| Ben H Parham Inc | $19,000 | -- | |
| Lancaster B A | -- | -- |
Source: Public Records
Tax History
| Year | Tax Paid | Tax Assessment Tax Assessment Total Assessment is a certain percentage of the fair market value that is determined by local assessors to be the total taxable value of land and additions on the property. | Land | Improvement |
|---|---|---|---|---|
| 2025 | $3,412 | $150,000 | $18,000 | $132,000 |
| 2024 | $3,412 | $127,080 | $18,000 | $109,080 |
| 2023 | $3,379 | $125,880 | $18,000 | $107,880 |
| 2022 | $3,257 | $118,680 | $18,000 | $100,680 |
| 2021 | $3,278 | $110,680 | $18,000 | $92,680 |
| 2020 | $3,278 | $110,680 | $18,000 | $92,680 |
| 2019 | $3,120 | $105,440 | $12,920 | $92,520 |
| 2018 | $2,987 | $101,040 | $12,920 | $88,120 |
| 2017 | $2,978 | $100,720 | $18,000 | $82,720 |
| 2016 | $2,954 | $99,942 | $18,000 | $81,942 |
| 2015 | $2,960 | $99,942 | $18,000 | $81,942 |
| 2014 | $2,693 | $90,987 | $12,956 | $78,031 |
| 2013 | -- | $85,436 | $12,696 | $72,740 |
Source: Public Records
Map
Nearby Homes
- 705 Piney Woods Dr
- 910 Piney Woods Dr
- 216 E Lane Cir
- 120 Saynor Cir
- 203 Waverly Way
- 105 Saynor Cir
- 598 Edmondson Ave
- 222 Beechwood Cir
- 724 Camellia Dr
- 0 Hills and Dales Farm Rd
- 106 Ewing St
- 732 Camellia Dr
- 109 Thomas St
- 203 S Chilton Crescent
- 201 S Chilton Crescent
- 219 Banks St
- 0 Ridley Ave Unit 10550104
- 609 Ridley Ave
- 707 Ridley Ave
- 611 Ridley Ave
- 526 Ridgecrest Rd
- 522 Ridgecrest Rd
- 528 Ridgecrest Rd
- 703 Larose Terrace
- 525 Ridgecrest Rd
- 759 Cherokee Rd
- 707 Larose Terrace
- 517 Ridgecrest Rd
- 529 Ridgecrest Rd
- 743 Cherokee Rd
- 516 Ridgecrest Rd
- 739 Cherokee Rd
- 711 Larose Terrace
- 515 Ridgecrest Rd
- 518 Pineview Terrace
- 513 Ridgecrest Rd
- 735 Cherokee Rd
- 600 Ridgecrest Rd
- 601 Ridgecrest Rd
- 717 Larose Terrace
Your Personal Tour Guide
Ask me questions while you tour the home.