Estimated Value: $93,000 - $182,000
2
Beds
2
Baths
1,607
Sq Ft
$83/Sq Ft
Est. Value
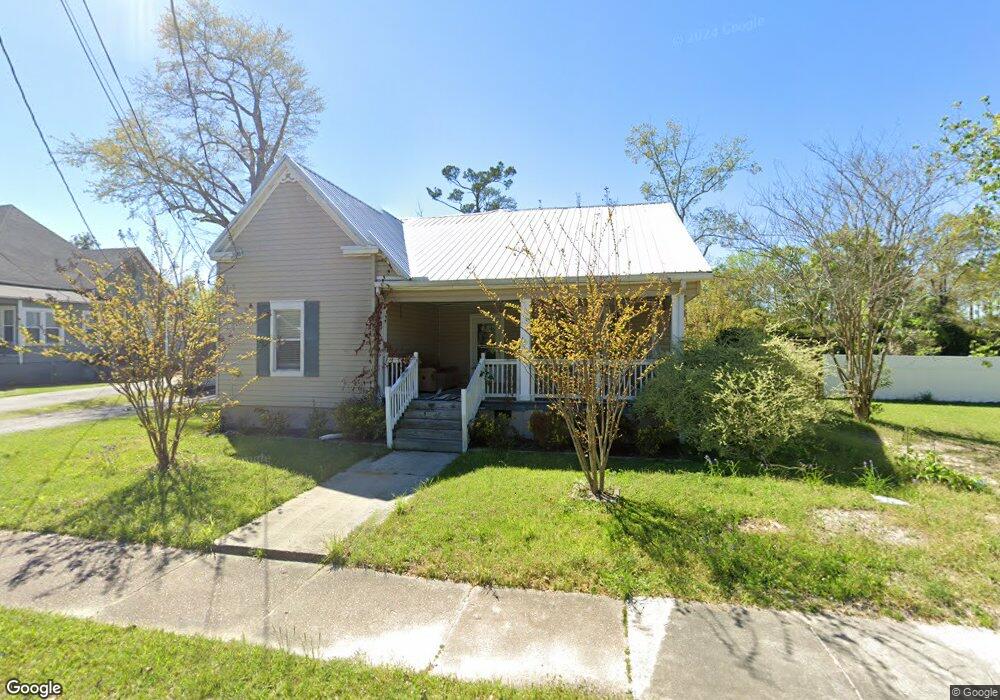
About This Home
This home is located at 524 S Broad St, Cairo, GA 39828 and is currently estimated at $133,179, approximately $82 per square foot. 524 S Broad St is a home located in Grady County with nearby schools including Cairo High School.
Ownership History
Date
Name
Owned For
Owner Type
Purchase Details
Closed on
May 23, 2023
Sold by
Mcdougall George
Bought by
Los Osfel Llc
Current Estimated Value
Purchase Details
Closed on
May 22, 2018
Sold by
Ingles Joseph P
Bought by
Mcdougall George and Mcdougall Donna
Home Financials for this Owner
Home Financials are based on the most recent Mortgage that was taken out on this home.
Original Mortgage
$41,000
Interest Rate
4.5%
Mortgage Type
New Conventional
Purchase Details
Closed on
May 5, 2017
Sold by
Cook Judy
Bought by
Ingles Joseph P and Ingles Holly Daneen
Purchase Details
Closed on
Oct 6, 2014
Sold by
Hurst Perry W
Bought by
Cook Judy
Purchase Details
Closed on
Jun 28, 2011
Sold by
Hurst Holly R
Bought by
Cook Judy
Purchase Details
Closed on
Nov 5, 1987
Sold by
Hurst Perry Winfred
Bought by
Hurst Holly Page
Purchase Details
Closed on
Apr 29, 1985
Sold by
Hurst Holly
Bought by
Hurst Perry W
Purchase Details
Closed on
Dec 17, 1971
Bought by
Hurst Holly
Create a Home Valuation Report for This Property
The Home Valuation Report is an in-depth analysis detailing your home's value as well as a comparison with similar homes in the area
Purchase History
| Date | Buyer | Sale Price | Title Company |
|---|---|---|---|
| Los Osfel Llc | $75,000 | -- | |
| Mcdougall George | $51,000 | -- | |
| Ingles Joseph P | $9,000 | -- | |
| Cook Judy | -- | -- | |
| Cook Judy | -- | -- | |
| Hurst Holly Page | -- | -- | |
| Hurst Perry W | -- | -- | |
| Hurst Holly | -- | -- |
Source: Public Records
Mortgage History
| Date | Status | Borrower | Loan Amount |
|---|---|---|---|
| Previous Owner | Mcdougall George | $41,000 |
Source: Public Records
Tax History
| Year | Tax Paid | Tax Assessment Tax Assessment Total Assessment is a certain percentage of the fair market value that is determined by local assessors to be the total taxable value of land and additions on the property. | Land | Improvement |
|---|---|---|---|---|
| 2024 | $1,186 | $41,667 | $2,420 | $39,247 |
| 2023 | $621 | $21,324 | $3,472 | $17,852 |
| 2022 | $652 | $21,324 | $3,472 | $17,852 |
| 2021 | $653 | $21,324 | $3,472 | $17,852 |
| 2020 | $655 | $21,324 | $3,472 | $17,852 |
| 2019 | $619 | $21,324 | $3,472 | $17,852 |
| 2018 | $519 | $14,098 | $3,472 | $10,626 |
| 2017 | $499 | $14,098 | $3,472 | $10,626 |
| 2016 | $439 | $12,138 | $3,472 | $8,666 |
| 2015 | $657 | $18,328 | $3,472 | $14,856 |
| 2014 | $657 | $18,328 | $3,472 | $14,856 |
| 2013 | -- | $16,612 | $3,472 | $13,140 |
Source: Public Records
Map
Nearby Homes
- 460 2nd St SW
- 309 3rd St SE
- 112 Pine Cir SW
- 471 4th St SE
- 117 SW Pine Cirlce
- 00 Hwy 111 South Tract 1
- X 1st St
- 0 1st St
- 580 5th St SE
- 530 6th Ave SE
- 1193 S Broad St
- 306 Midland Place
- 4761 Hadley Ferry Rd
- 00 Blackberry Ln
- 00 Meridian Rd
- 0 Georgia 111
- 320 8th St SW
- 125 6th Ave NW
- 530 6th St
- 711 2nd Ave NE
Your Personal Tour Guide
Ask me questions while you tour the home.