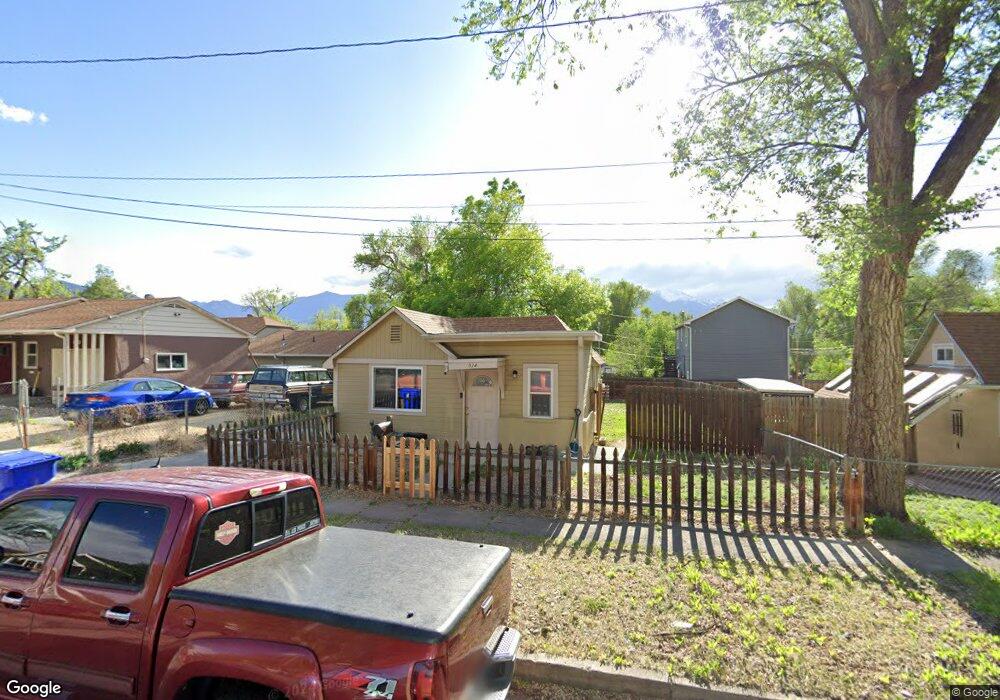
524 S Cedar St Colorado Springs, CO 80903
Hillside/East Lake NeighborhoodEstimated Value: $293,000 - $320,000
2
Beds
1
Bath
635
Sq Ft
$481/Sq Ft
Est. Value
About This Home
This home is located at 524 S Cedar St, Colorado Springs, CO 80903 and is currently estimated at $305,192, approximately $480 per square foot. 524 S Cedar St is a home located in El Paso County with nearby schools including Adams Elementary School, North Middle School, and William J. Palmer High School.
Ownership History
Date
Name
Owned For
Owner Type
Purchase Details
Closed on
Jun 7, 2013
Sold by
Martinez Louis P
Bought by
Wealth & Growth Llc
Current Estimated Value
Purchase Details
Closed on
May 28, 1999
Sold by
Martinez Louis P and Martinez Henry F
Bought by
Martinez Louis P
Purchase Details
Closed on
Sep 15, 1998
Sold by
Frame Floyd E and Frame Kimberly
Bought by
Pullen Robin J and Pullen Eric J
Home Financials for this Owner
Home Financials are based on the most recent Mortgage that was taken out on this home.
Original Mortgage
$73,875
Interest Rate
11.25%
Purchase Details
Closed on
Oct 11, 1978
Bought by
Wealth & Growth Llc
Purchase Details
Closed on
Mar 19, 1976
Bought by
Wealth & Growth Llc
Purchase Details
Closed on
Jan 11, 1974
Bought by
Wealth & Growth Llc
Purchase Details
Closed on
Mar 5, 1973
Bought by
Wealth & Growth Llc
Create a Home Valuation Report for This Property
The Home Valuation Report is an in-depth analysis detailing your home's value as well as a comparison with similar homes in the area
Home Values in the Area
Average Home Value in this Area
Purchase History
| Date | Buyer | Sale Price | Title Company |
|---|---|---|---|
| Wealth & Growth Llc | $40,000 | Heritage Title | |
| Martinez Louis P | $20,000 | -- | |
| Pullen Robin J | $98,500 | Stewart Title | |
| Wealth & Growth Llc | -- | -- | |
| Wealth & Growth Llc | -- | -- | |
| Wealth & Growth Llc | -- | -- | |
| Wealth & Growth Llc | -- | -- |
Source: Public Records
Mortgage History
| Date | Status | Borrower | Loan Amount |
|---|---|---|---|
| Previous Owner | Pullen Robin J | $73,875 | |
| Closed | Pullen Robin J | $24,625 |
Source: Public Records
Tax History Compared to Growth
Tax History
| Year | Tax Paid | Tax Assessment Tax Assessment Total Assessment is a certain percentage of the fair market value that is determined by local assessors to be the total taxable value of land and additions on the property. | Land | Improvement |
|---|---|---|---|---|
| 2025 | $776 | $18,510 | -- | -- |
| 2024 | $669 | $18,340 | $3,510 | $14,830 |
| 2022 | $593 | $10,590 | $3,250 | $7,340 |
| 2021 | $643 | $10,900 | $3,350 | $7,550 |
| 2020 | $588 | $8,660 | $2,570 | $6,090 |
| 2019 | $585 | $8,660 | $2,570 | $6,090 |
| 2018 | $466 | $6,350 | $1,940 | $4,410 |
| 2017 | $441 | $6,350 | $1,940 | $4,410 |
| 2016 | $336 | $5,800 | $1,790 | $4,010 |
| 2015 | $335 | $5,800 | $1,790 | $4,010 |
| 2014 | $326 | $5,420 | $1,670 | $3,750 |
Source: Public Records
Map
Nearby Homes
- 944 E Moreno Ave Unit A & B
- 917 E Cimarron St
- 1015 E Moreno Ave
- 947 E Costilla St
- 833 E Moreno Ave
- 909 E Costilla St
- 1023 E Costilla St
- 1113 E Cimarron St
- 1028 E Costilla St
- 1119 E Rio Grande St
- 529 S Prospect St
- 1017 E Las Animas St
- 801 E Costilla St
- 232 S Hancock Ave
- 832 E Vermijo Ave
- 906 S Institute St
- 723 S Foote Ave
- 909 S Arcadia St
- 735 E Vermijo Ave
- 725 E Las Animas St
- 520 S Cedar St
- 946 E Moreno Ave
- 530 S Cedar St
- 944 E Moreno Ave
- 514 S Cedar St
- 940 E Moreno Ave
- 510 S Cedar St
- 523 S Cedar St
- 519 S Cedar St
- 936 E Moreno Ave
- 527 S Cedar St
- 941 E Cimarron St
- 513 S Cedar St
- 529 S Cedar St
- 932 E Moreno Ave
- 935 E Cimarron St
- 947 E Cimarron St
- 943 E Cimarron St
- 507 S Cedar St
- 933 E Cimarron St