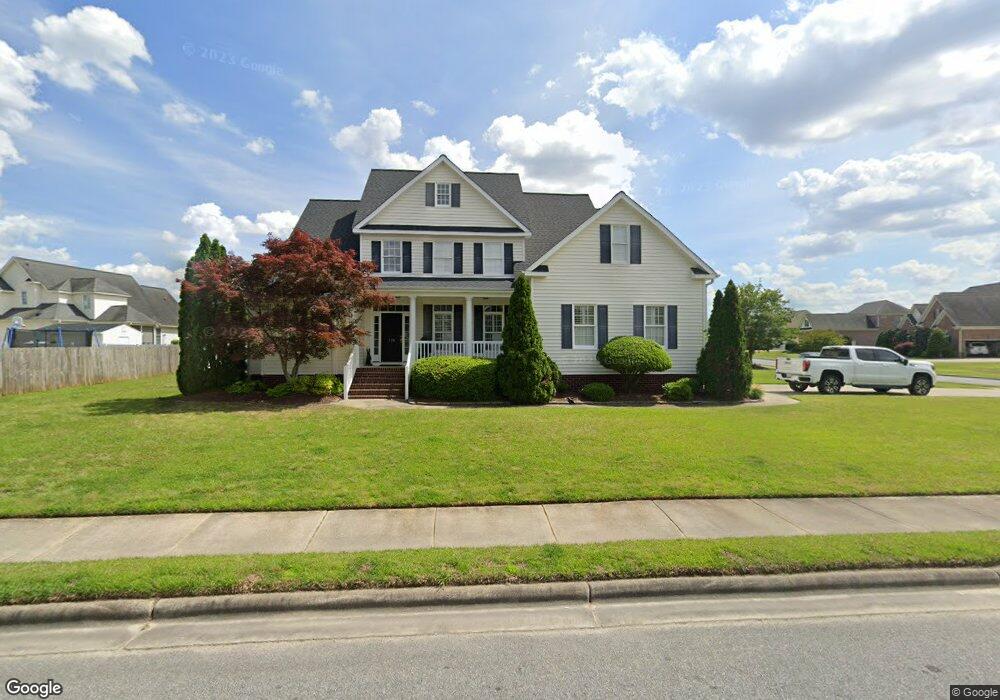
524 Stillwater Dr Winterville, NC 28590
Estimated Value: $417,000 - $450,000
3
Beds
3
Baths
3,029
Sq Ft
$143/Sq Ft
Est. Value
About This Home
This home is located at 524 Stillwater Dr, Winterville, NC 28590 and is currently estimated at $432,927, approximately $142 per square foot. 524 Stillwater Dr is a home located in Pitt County with nearby schools including Wintergreen Primary School, Wintergreen Intermediate School, and Hope Middle School.
Ownership History
Date
Name
Owned For
Owner Type
Purchase Details
Closed on
Dec 23, 2011
Sold by
Chadwick Edward R and Chadwick Joanne L
Bought by
Ledbetter Jonathan Parker and Ledbetter Natalie H
Current Estimated Value
Home Financials for this Owner
Home Financials are based on the most recent Mortgage that was taken out on this home.
Original Mortgage
$160,000
Outstanding Balance
$109,713
Interest Rate
4.06%
Mortgage Type
New Conventional
Estimated Equity
$323,214
Purchase Details
Closed on
Apr 21, 2005
Sold by
Bigg Construction Inc
Bought by
Chadwick Edward R and Chadwick Joanne L
Home Financials for this Owner
Home Financials are based on the most recent Mortgage that was taken out on this home.
Original Mortgage
$247,920
Interest Rate
5.87%
Mortgage Type
Adjustable Rate Mortgage/ARM
Create a Home Valuation Report for This Property
The Home Valuation Report is an in-depth analysis detailing your home's value as well as a comparison with similar homes in the area
Home Values in the Area
Average Home Value in this Area
Purchase History
| Date | Buyer | Sale Price | Title Company |
|---|---|---|---|
| Ledbetter Jonathan Parker | $200,000 | None Available | |
| Chadwick Edward R | $310,000 | None Available |
Source: Public Records
Mortgage History
| Date | Status | Borrower | Loan Amount |
|---|---|---|---|
| Open | Ledbetter Jonathan Parker | $160,000 | |
| Previous Owner | Chadwick Edward R | $247,920 |
Source: Public Records
Tax History Compared to Growth
Tax History
| Year | Tax Paid | Tax Assessment Tax Assessment Total Assessment is a certain percentage of the fair market value that is determined by local assessors to be the total taxable value of land and additions on the property. | Land | Improvement |
|---|---|---|---|---|
| 2025 | $2,832 | $429,550 | $50,000 | $379,550 |
| 2024 | $2,820 | $429,550 | $50,000 | $379,550 |
| 2023 | $2,293 | $293,687 | $34,000 | $259,687 |
| 2022 | $2,304 | $293,687 | $34,000 | $259,687 |
| 2021 | $2,293 | $293,687 | $34,000 | $259,687 |
| 2020 | $2,308 | $293,687 | $34,000 | $259,687 |
| 2019 | $2,357 | $293,778 | $34,000 | $259,778 |
| 2018 | $2,251 | $293,778 | $34,000 | $259,778 |
| 2017 | $2,251 | $293,778 | $34,000 | $259,778 |
| 2016 | $2,136 | $293,778 | $34,000 | $259,778 |
| 2015 | $2,136 | $284,478 | $40,000 | $244,478 |
| 2014 | $2,136 | $284,478 | $40,000 | $244,478 |
Source: Public Records
Map
Nearby Homes
- 2243 Black Horse Ln
- 4695 Old Tar Rd
- 2136 Winder Dr
- 561 Channel Dr
- 133 Blackwater Dr
- 2335 Wedgewood Dr
- 2203 Franklin Dr
- 2000 Cornerstone Dr
- 626 Winterfield Dr
- 2061 Cornerstone Dr
- 4211 Old Tar Rd
- 731 Winterfield Dr
- 334 Vernon White Rd
- 874 Corbett St
- 763 Winterfield Dr
- 102 Sunshine Ln Unit D
- 422 Hidden Branches Close
- 626 Edenbrook Dr
- 2414 Glenda St
- 115 Sunshine Ln Unit C
- 513 Stillwater Dr
- 532 Cedar Ridge Dr
- 2218 Black Horse Ln
- 519 Stillwater Dr
- 2226 Black Horse Ln
- 506 Stillwater Dr
- 521 Cedar Ridge Dr
- 535 Cedar Ridge Dr
- 506 Cedar Ridge Dr
- 514 Stillwater Dr
- 509 Cedar Ridge Dr
- 2232 Black Horse Ln
- 527 Stillwater Dr
- 547 Cedar Ridge Dr
- 522 Stillwater Dr
- 550 Cedar Ridge Dr
- 2215 Black Horse Ln
- 2221 Black Horse Ln
- 2240 Black Horse Ln
- 539 Stillwater Dr