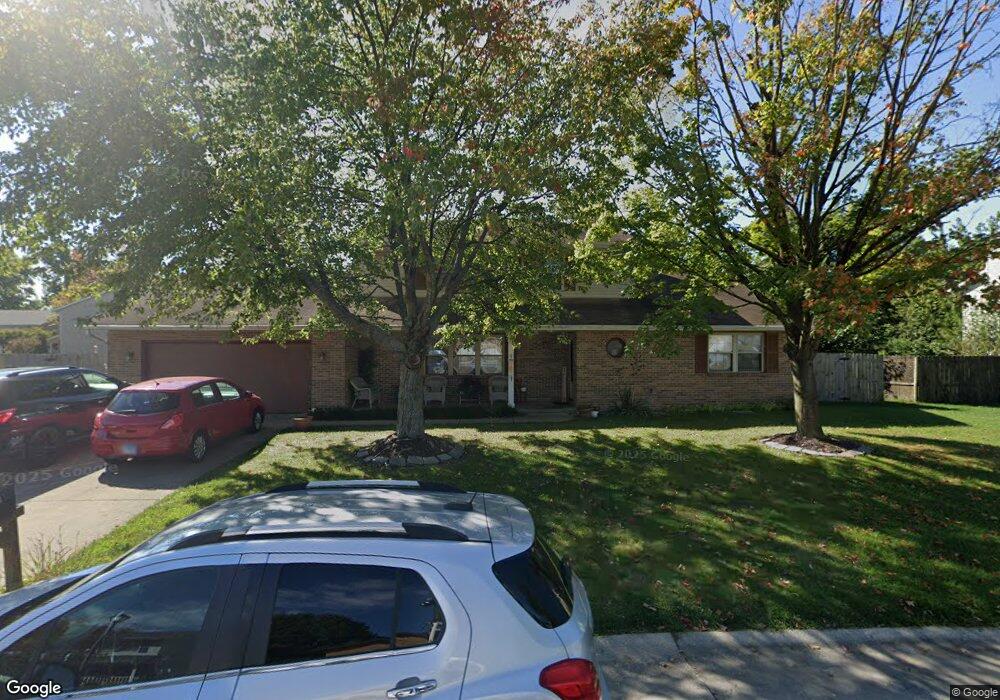
524 Thrush Ln Swansea, IL 62226
Estimated Value: $260,000 - $330,332
--
Bed
--
Bath
840
Sq Ft
$347/Sq Ft
Est. Value
About This Home
This home is located at 524 Thrush Ln, Swansea, IL 62226 and is currently estimated at $291,583, approximately $347 per square foot. 524 Thrush Ln is a home located in St. Clair County with nearby schools including Wolf Branch Elementary School, Wolf Branch Middle School, and Elite Scholars STEAM Academy.
Ownership History
Date
Name
Owned For
Owner Type
Purchase Details
Closed on
Dec 1, 2006
Sold by
Lallish William A and Lallish Connie M
Bought by
Harrington Turner Gwendolyn A
Current Estimated Value
Home Financials for this Owner
Home Financials are based on the most recent Mortgage that was taken out on this home.
Original Mortgage
$154,400
Outstanding Balance
$97,272
Interest Rate
7.3%
Mortgage Type
Purchase Money Mortgage
Estimated Equity
$194,311
Purchase Details
Closed on
May 31, 2002
Sold by
Mccarthy Crystal A and Mccarthy Michael J
Bought by
Lallish William A and Lallish Connie M
Home Financials for this Owner
Home Financials are based on the most recent Mortgage that was taken out on this home.
Original Mortgage
$162,180
Interest Rate
7%
Mortgage Type
VA
Purchase Details
Closed on
Jan 15, 2001
Sold by
Mccarthy Michael J and Mccarthy Crystal A
Bought by
Mccarthy Crystal A and Mccarthy Michael J
Create a Home Valuation Report for This Property
The Home Valuation Report is an in-depth analysis detailing your home's value as well as a comparison with similar homes in the area
Home Values in the Area
Average Home Value in this Area
Purchase History
| Date | Buyer | Sale Price | Title Company |
|---|---|---|---|
| Harrington Turner Gwendolyn A | $193,000 | Chicago Title | |
| Lallish William A | $159,066 | Fleet County Title Co | |
| Mccarthy Crystal A | -- | -- |
Source: Public Records
Mortgage History
| Date | Status | Borrower | Loan Amount |
|---|---|---|---|
| Open | Harrington Turner Gwendolyn A | $154,400 | |
| Previous Owner | Lallish William A | $162,180 |
Source: Public Records
Tax History Compared to Growth
Tax History
| Year | Tax Paid | Tax Assessment Tax Assessment Total Assessment is a certain percentage of the fair market value that is determined by local assessors to be the total taxable value of land and additions on the property. | Land | Improvement |
|---|---|---|---|---|
| 2024 | $7,104 | $94,383 | $10,107 | $84,276 |
| 2023 | $6,706 | $88,635 | $9,968 | $78,667 |
| 2022 | $6,241 | $80,724 | $9,078 | $71,646 |
| 2021 | $6,082 | $77,410 | $8,705 | $68,705 |
| 2020 | $5,900 | $72,089 | $8,106 | $63,983 |
| 2019 | $5,672 | $71,357 | $8,272 | $63,085 |
| 2018 | $5,518 | $69,535 | $8,061 | $61,474 |
| 2017 | $5,367 | $67,683 | $7,846 | $59,837 |
| 2016 | $5,326 | $65,350 | $7,576 | $57,774 |
| 2014 | $4,455 | $62,146 | $7,536 | $54,610 |
| 2013 | $5,471 | $62,146 | $7,536 | $54,610 |
Source: Public Records
Map
Nearby Homes
- 525 Big Bend Blvd
- 505 Thistle Ln
- 3920 Michael John Dr
- 3837 N Illinois St
- 201 Big Bend Blvd
- 116 Lakeland Blvd
- 109 Bourdelais Dr
- 1709 Old Park Ln
- 1705 Old Park Ln
- 1861 Old Park Ln
- 1857 Old Park Ln
- 1737 Old Park Ln
- 3928 Red Bird Ln
- 3924 Red Bird Ln
- 3920 Red Bird Ln
- 3916 Red Bird Ln
- 1853 Old Park Ln
- 3912 Red Bird Ln
- 1849 Old Park Ln
- 1745 Old Park Ln
- 528 Thrush Ln
- 3 Midland Ct
- 516 Big Bend Blvd
- 7 Midland Ct
- 529 Thrush Ln
- 525 Thrush Ln
- 520 Big Bend Blvd
- 533 Thrush Ln
- 521 Thrush Ln
- 11 Midland Ct
- 517 Thrush Ln
- 517 Big Bend Blvd
- 513 Big Bend Blvd
- 528 Homestead Ave
- 524 Homestead Ave
- 521 Big Bend Blvd
- 509 Big Bend Blvd
- 532 Homestead Ave
- 4 Midland Ct
- 520 Homestead Ave