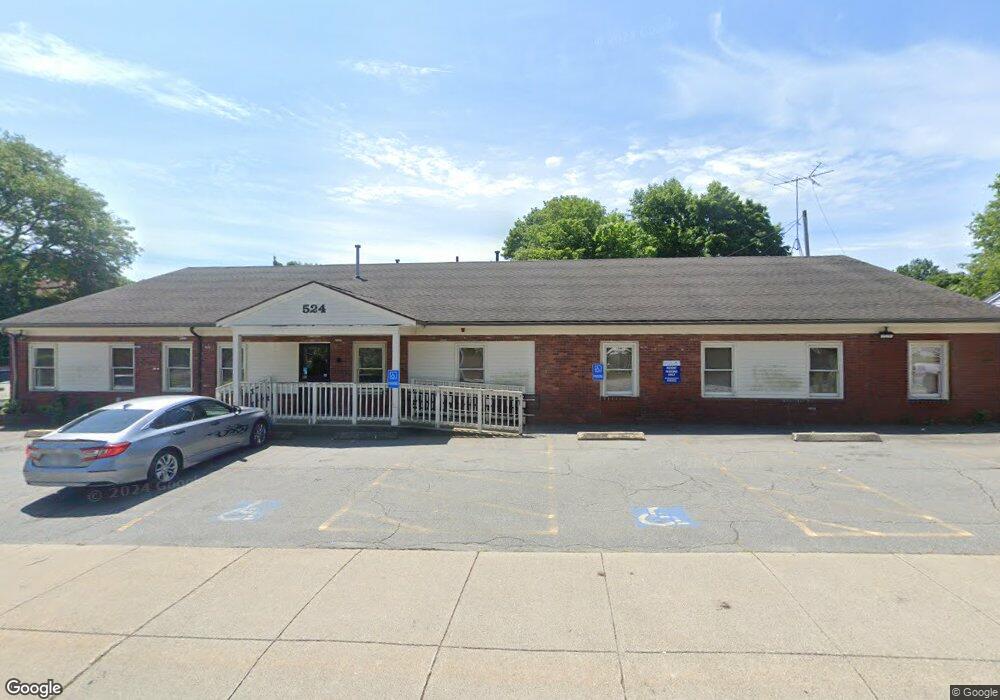
524 Union St New Bedford, MA 02740
Downtown New Bedford NeighborhoodEstimated Value: $981,072
3
Beds
2
Baths
5,304
Sq Ft
$185/Sq Ft
Est. Value
About This Home
This home is located at 524 Union St, New Bedford, MA 02740 and is currently estimated at $981,072, approximately $184 per square foot. 524 Union St is a home located in Bristol County with nearby schools including Ellen R. Hathaway Elementary School, Keith Middle School, and New Bedford High School.
Ownership History
Date
Name
Owned For
Owner Type
Purchase Details
Closed on
Dec 8, 2015
Sold by
Rush Realty Holdings L
Bought by
Mta Realty Llc
Current Estimated Value
Home Financials for this Owner
Home Financials are based on the most recent Mortgage that was taken out on this home.
Original Mortgage
$220,000
Outstanding Balance
$173,750
Interest Rate
3.83%
Mortgage Type
Commercial
Estimated Equity
$807,322
Purchase Details
Closed on
Jan 8, 2007
Sold by
Rush Rt
Bought by
Rush Rlty Holdings Llc
Purchase Details
Closed on
May 31, 1995
Sold by
Bogosky Ronald T
Bought by
Rush Rt
Purchase Details
Closed on
Jun 1, 1994
Sold by
Phillips Bldg Assoc
Bought by
Alan Real Est Ltd
Home Financials for this Owner
Home Financials are based on the most recent Mortgage that was taken out on this home.
Original Mortgage
$230,000
Interest Rate
8.49%
Mortgage Type
Commercial
Create a Home Valuation Report for This Property
The Home Valuation Report is an in-depth analysis detailing your home's value as well as a comparison with similar homes in the area
Home Values in the Area
Average Home Value in this Area
Purchase History
| Date | Buyer | Sale Price | Title Company |
|---|---|---|---|
| Mta Realty Llc | $410,000 | -- | |
| Mta Realty Llc | $410,000 | -- | |
| Rush Rt | -- | -- | |
| Rush Rt | -- | -- | |
| Rush Rlty Holdings Llc | -- | -- | |
| Rush Rlty Holdings Llc | -- | -- | |
| Rush Rt | $263,683 | -- | |
| Rush Rt | $263,683 | -- | |
| Alan Real Est Ltd | $215,000 | -- | |
| Alan Real Est Ltd | $215,000 | -- |
Source: Public Records
Mortgage History
| Date | Status | Borrower | Loan Amount |
|---|---|---|---|
| Open | Mta Realty Llc | $220,000 | |
| Closed | Mta Realty Llc | $220,000 | |
| Previous Owner | Alan Real Est Ltd | $230,000 |
Source: Public Records
Tax History Compared to Growth
Tax History
| Year | Tax Paid | Tax Assessment Tax Assessment Total Assessment is a certain percentage of the fair market value that is determined by local assessors to be the total taxable value of land and additions on the property. | Land | Improvement |
|---|---|---|---|---|
| 2025 | $13,534 | $592,300 | $193,700 | $398,600 |
| 2024 | $13,379 | $536,000 | $131,400 | $404,600 |
| 2023 | $12,305 | $411,800 | $121,100 | $290,700 |
| 2022 | $13,364 | $398,800 | $116,200 | $282,600 |
| 2021 | $5,160 | $383,700 | $110,700 | $273,000 |
| 2020 | $4,988 | $383,700 | $110,700 | $273,000 |
| 2019 | $13,264 | $380,700 | $110,700 | $270,000 |
| 2018 | $14,880 | $417,400 | $110,700 | $306,700 |
| 2017 | $14,934 | $414,500 | $110,700 | $303,800 |
| 2016 | $15,697 | $438,100 | $110,700 | $327,400 |
| 2015 | $14,847 | $442,400 | $117,600 | $324,800 |
| 2014 | $13,750 | $442,400 | $117,600 | $324,800 |
Source: Public Records
Map
Nearby Homes
- 516 Union St Unit 518
- 516 Union St Unit 2
- 516 Union St Unit 3
- 119 Tremont St
- 137 Tremont St
- 116 St Unit 1
- 0 Penniman St (Ss) Unit 70530404
- 0 Address Withheld Unit 72326207
- 0 Address Withheld Unit 71274501
- 000 Call for Address
- 0 Address Withheld Unit 71357715
- 0 Address Withheld Unit 70848596
- 0 Address Withheld Unit 70890794
- 000 Xxxxxxxx
- 0 Address Withheld Unit 71047534
- 0 Address Withheld Unit 71680317
- WS Tradewind St
- Parcel A Rockdale Ave
- NS Manomet St
- WS E E Rodney French Blvd