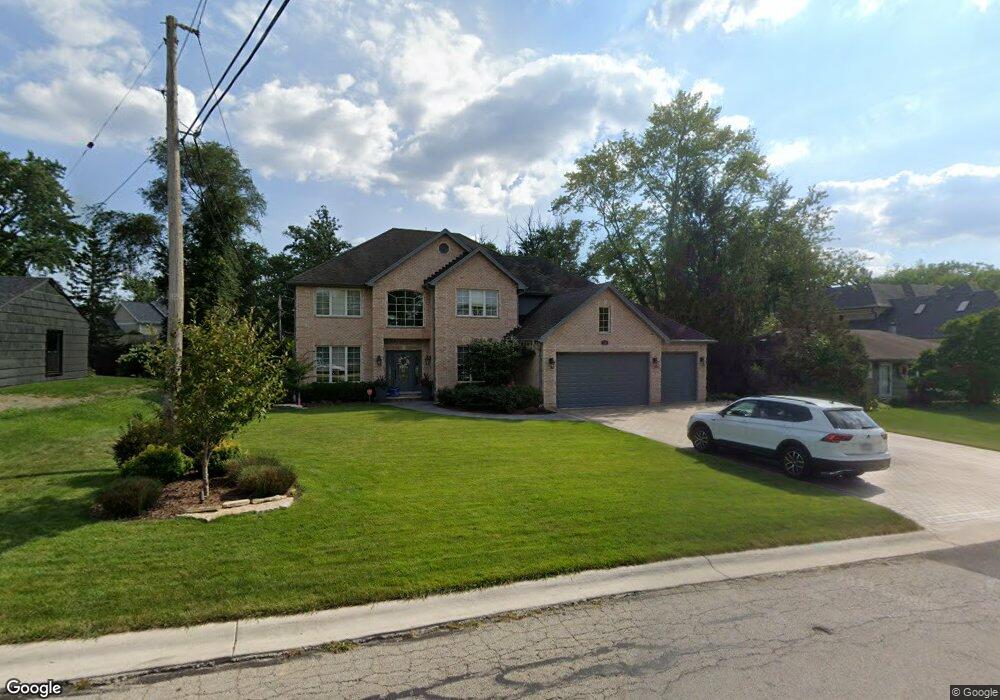
524 W 58th St Hinsdale, IL 60521
Estimated Value: $1,202,000 - $1,495,000
5
Beds
5
Baths
3,364
Sq Ft
$418/Sq Ft
Est. Value
About This Home
This home is located at 524 W 58th St, Hinsdale, IL 60521 and is currently estimated at $1,405,619, approximately $417 per square foot. 524 W 58th St is a home located in DuPage County with nearby schools including Holmes Elementary School, Maercker Elementary School, and Westview Hills Middle School.
Ownership History
Date
Name
Owned For
Owner Type
Purchase Details
Closed on
Apr 10, 2017
Sold by
Cartus Financial Corp
Bought by
Andrews Pete and Andrews Michelle
Current Estimated Value
Home Financials for this Owner
Home Financials are based on the most recent Mortgage that was taken out on this home.
Original Mortgage
$574,440
Interest Rate
3.85%
Mortgage Type
New Conventional
Purchase Details
Closed on
Sep 26, 2016
Sold by
Lynch Thomas F and Lynch Patricia E
Bought by
Cartus Financial Corporation
Purchase Details
Closed on
Mar 14, 2000
Sold by
Djuric Zivan D and Alavie Home Builders
Bought by
Lynch Patricia E and Lynch Thomas F
Home Financials for this Owner
Home Financials are based on the most recent Mortgage that was taken out on this home.
Original Mortgage
$600,000
Interest Rate
6.5%
Purchase Details
Closed on
May 28, 1999
Sold by
Swiatlowski Paul R and Swiatlowski Sara Annette
Bought by
Djuric Zivan D
Create a Home Valuation Report for This Property
The Home Valuation Report is an in-depth analysis detailing your home's value as well as a comparison with similar homes in the area
Home Values in the Area
Average Home Value in this Area
Purchase History
| Date | Buyer | Sale Price | Title Company |
|---|---|---|---|
| Andrews Pete | -- | Burnet Title Post Closing | |
| Cartus Financial Corporation | $1,012,500 | Burnet Title | |
| Lynch Patricia E | $750,000 | First American Title Ins | |
| Djuric Zivan D | $189,000 | Chicago Title Insurance Co |
Source: Public Records
Mortgage History
| Date | Status | Borrower | Loan Amount |
|---|---|---|---|
| Previous Owner | Andrews Pete | $574,440 | |
| Previous Owner | Lynch Patricia E | $600,000 |
Source: Public Records
Tax History Compared to Growth
Tax History
| Year | Tax Paid | Tax Assessment Tax Assessment Total Assessment is a certain percentage of the fair market value that is determined by local assessors to be the total taxable value of land and additions on the property. | Land | Improvement |
|---|---|---|---|---|
| 2024 | $19,688 | $381,133 | $119,223 | $261,910 |
| 2023 | $18,924 | $350,370 | $109,600 | $240,770 |
| 2022 | $13,780 | $257,380 | $107,340 | $150,040 |
| 2021 | $13,355 | $254,450 | $106,120 | $148,330 |
| 2020 | $13,116 | $249,410 | $104,020 | $145,390 |
| 2019 | $12,698 | $239,310 | $99,810 | $139,500 |
| 2018 | $12,936 | $239,330 | $99,210 | $140,120 |
| 2017 | $12,723 | $239,330 | $95,470 | $143,860 |
| 2016 | $15,750 | $292,740 | $91,110 | $201,630 |
| 2015 | $15,614 | $275,420 | $85,720 | $189,700 |
| 2014 | $14,775 | $259,000 | $83,340 | $175,660 |
| 2013 | $14,394 | $257,790 | $82,950 | $174,840 |
Source: Public Records
Map
Nearby Homes
- 5720 S Madison St
- 424 Ashbury Dr Unit 39
- 422 58th Place Unit 7
- 494 Old Surrey Rd Unit C
- 5701 Foxgate Ln
- 818 W 58th St
- 80 W Kennedy Ln Unit 304
- 5524 S Bruner St
- 5545 S Stough St
- 928 S Monroe St
- 903 S Madison St
- 531 Carlysle Dr Unit 9
- 501 Carlysle Dr Unit 9
- 550 Chase Dr Unit 2
- 5740 Concord Ln Unit 12
- 5841 Sunrise Ave
- 28 E 55th St
- 564 Willowcreek Ct Unit 411
- 24 S Washington Cir
- 5603 S Garfield St
- 530 W 58th St
- 5802 S Thurlow St
- 5810 S Thurlow St
- 536 W 58th St
- 525 W 58th Place
- 529 W 58th Place
- 5818 S Thurlow St
- 5751 S Monroe St
- 5760 S Thurlow St
- 535 W 58th Place
- 542 W 58th St
- 5809 S Thurlow St
- 541 W 58th Place
- 5747 S Monroe St
- 5801 S Thurlow St
- 548 W 58th St
- 5760 S Monroe St
- 5817 S Thurlow St
- 5759 S Thurlow St
- 547 W 58th Place