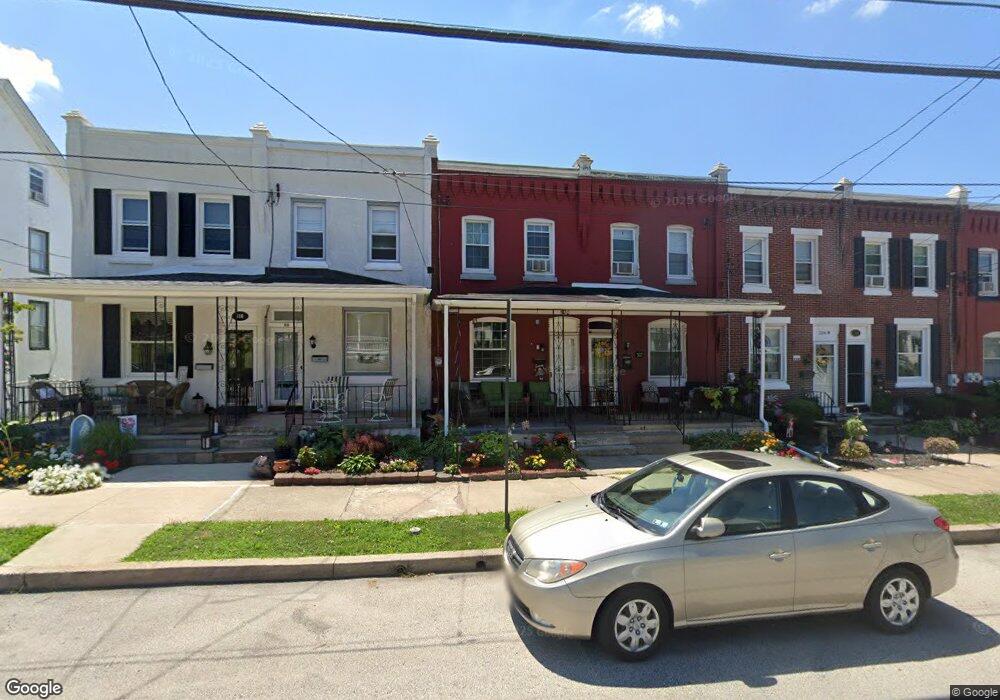
524 W High St Phoenixville, PA 19460
Estimated Value: $283,227 - $389,000
3
Beds
1
Bath
1,162
Sq Ft
$283/Sq Ft
Est. Value
About This Home
This home is located at 524 W High St, Phoenixville, PA 19460 and is currently estimated at $329,057, approximately $283 per square foot. 524 W High St is a home located in Chester County with nearby schools including Phoenixville Area Middle School, Phoenixville Area High School, and Renaissance Academy.
Ownership History
Date
Name
Owned For
Owner Type
Purchase Details
Closed on
Jul 27, 2023
Sold by
Nyce Susan A and Valenteen Tina Marie
Bought by
Nyce Susan A and Valenteen Tina Marie
Current Estimated Value
Purchase Details
Closed on
Jan 3, 2002
Sold by
Nyce Susan A
Bought by
Nyce Susan A and Valenteen Tina Marie
Purchase Details
Closed on
Jun 25, 2001
Sold by
Nyce Susan and Valenteen Tina Marie
Bought by
Nyce Susan
Home Financials for this Owner
Home Financials are based on the most recent Mortgage that was taken out on this home.
Original Mortgage
$68,000
Interest Rate
6.72%
Create a Home Valuation Report for This Property
The Home Valuation Report is an in-depth analysis detailing your home's value as well as a comparison with similar homes in the area
Home Values in the Area
Average Home Value in this Area
Purchase History
| Date | Buyer | Sale Price | Title Company |
|---|---|---|---|
| Nyce Susan A | -- | None Listed On Document | |
| Nyce Susan A | -- | -- | |
| Nyce Susan | -- | -- |
Source: Public Records
Mortgage History
| Date | Status | Borrower | Loan Amount |
|---|---|---|---|
| Previous Owner | Nyce Susan | $68,000 |
Source: Public Records
Tax History Compared to Growth
Tax History
| Year | Tax Paid | Tax Assessment Tax Assessment Total Assessment is a certain percentage of the fair market value that is determined by local assessors to be the total taxable value of land and additions on the property. | Land | Improvement |
|---|---|---|---|---|
| 2025 | $2,949 | $64,240 | $21,650 | $42,590 |
| 2024 | $2,949 | $64,240 | $21,650 | $42,590 |
| 2023 | $2,883 | $64,240 | $21,650 | $42,590 |
| 2022 | $2,839 | $64,240 | $21,650 | $42,590 |
| 2021 | $2,799 | $64,240 | $21,650 | $42,590 |
| 2020 | $2,685 | $64,240 | $21,650 | $42,590 |
| 2019 | $2,636 | $64,240 | $21,650 | $42,590 |
| 2018 | $2,561 | $64,240 | $21,650 | $42,590 |
| 2017 | $2,521 | $64,240 | $21,650 | $42,590 |
| 2016 | $255 | $64,240 | $21,650 | $42,590 |
| 2015 | $255 | $64,240 | $21,650 | $42,590 |
| 2014 | $255 | $64,240 | $21,650 | $42,590 |
Source: Public Records
Map
Nearby Homes
- 958 Skylar Ct
- 787 Ore St
- 784 Ore St
- 252 Smithworks Blvd
- 235 Smithworks Blvd
- 750 Ore St
- Holley Plan at Steelpointe
- 420 Lopata Rd
- 708 Ore St
- 702 Ore St
- 700 Ore St
- 704 Ore St
- 637 Burcham St
- 706 Ore St
- 187 Smithworks Blvd
- 355 Emmett St
- 431 Smithworks Blvd
- 429 Smithworks Blvd
- 433 Smithworks Blvd
- 1124 Utley Alley