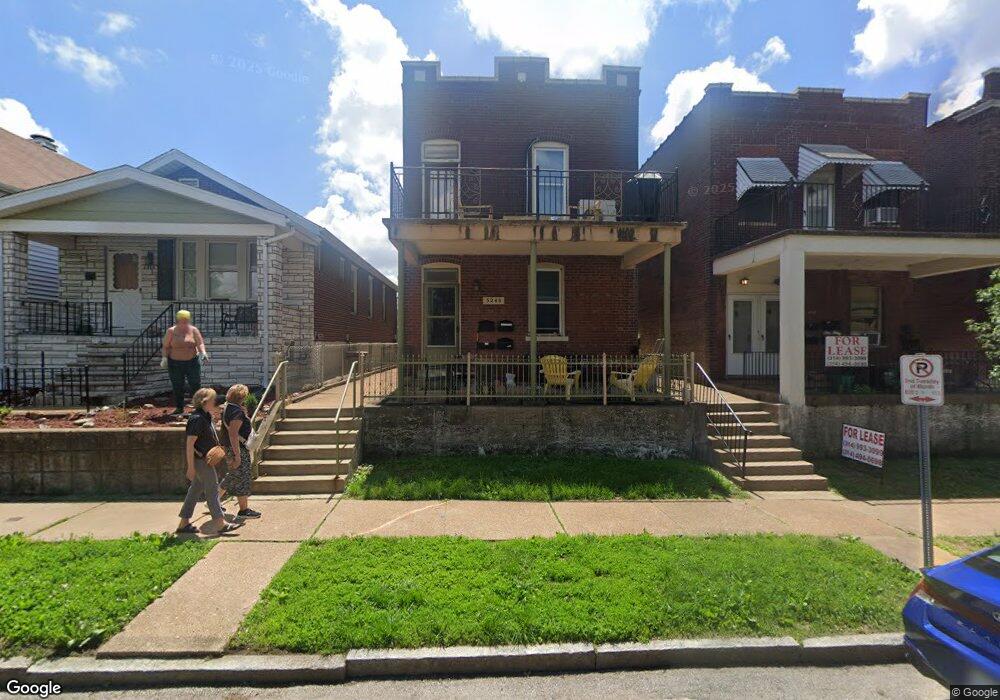
5240 Wilson Ave Saint Louis, MO 63110
The Hill NeighborhoodEstimated Value: $400,000 - $493,000
--
Bed
4
Baths
2,812
Sq Ft
$157/Sq Ft
Est. Value
About This Home
This home is located at 5240 Wilson Ave, Saint Louis, MO 63110 and is currently estimated at $442,304, approximately $157 per square foot. 5240 Wilson Ave is a home located in St. Louis City with nearby schools including Mason Elementary School, Long International Middle School, and Roosevelt High School.
Ownership History
Date
Name
Owned For
Owner Type
Purchase Details
Closed on
Aug 16, 2017
Sold by
Adams Nicholas C and Young Trisha M
Bought by
Adams Nicholas C and Young Trisha M
Current Estimated Value
Home Financials for this Owner
Home Financials are based on the most recent Mortgage that was taken out on this home.
Original Mortgage
$205,535
Outstanding Balance
$171,503
Interest Rate
3.96%
Mortgage Type
FHA
Estimated Equity
$270,801
Purchase Details
Closed on
Aug 22, 2016
Sold by
Fresta Joseph M and Jerden Carmella Ann
Bought by
Adams Nicholas C and Young Trisha M
Home Financials for this Owner
Home Financials are based on the most recent Mortgage that was taken out on this home.
Original Mortgage
$202,500
Interest Rate
4.12%
Mortgage Type
Adjustable Rate Mortgage/ARM
Purchase Details
Closed on
Aug 24, 2002
Sold by
Fresta Paul S and Fresta Rose Marie
Bought by
Fresta Paul S and Fresta Rose Marie
Create a Home Valuation Report for This Property
The Home Valuation Report is an in-depth analysis detailing your home's value as well as a comparison with similar homes in the area
Home Values in the Area
Average Home Value in this Area
Purchase History
| Date | Buyer | Sale Price | Title Company |
|---|---|---|---|
| Adams Nicholas C | -- | Chesterfield Title Agency Ll | |
| Adams Nicholas C | $225,000 | Ust | |
| Fresta Paul S | -- | -- |
Source: Public Records
Mortgage History
| Date | Status | Borrower | Loan Amount |
|---|---|---|---|
| Open | Adams Nicholas C | $205,535 | |
| Closed | Adams Nicholas C | $202,500 |
Source: Public Records
Tax History Compared to Growth
Tax History
| Year | Tax Paid | Tax Assessment Tax Assessment Total Assessment is a certain percentage of the fair market value that is determined by local assessors to be the total taxable value of land and additions on the property. | Land | Improvement |
|---|---|---|---|---|
| 2025 | $3,006 | $44,020 | $1,790 | $42,230 |
| 2024 | $2,859 | $35,570 | $1,790 | $33,780 |
| 2023 | $2,859 | $35,570 | $1,790 | $33,780 |
| 2022 | $2,648 | $31,690 | $1,790 | $29,900 |
| 2021 | $2,644 | $31,690 | $1,790 | $29,900 |
| 2020 | $2,623 | $31,690 | $1,790 | $29,900 |
| 2019 | $2,614 | $31,700 | $1,790 | $29,910 |
| 2018 | $2,458 | $28,860 | $1,670 | $27,190 |
| 2017 | $2,416 | $28,860 | $1,670 | $27,190 |
| 2016 | $1,677 | $19,670 | $1,670 | $17,990 |
| 2015 | $1,521 | $19,660 | $1,670 | $17,990 |
| 2014 | $1,474 | $19,660 | $1,670 | $17,990 |
| 2013 | -- | $19,060 | $1,670 | $17,390 |
Source: Public Records
Map
Nearby Homes
- 2235 Edwards St
- 2235 Cuggiono Ct
- 2016 Hereford St
- 5124 Shaw Ave
- 2103 Boardman St
- 2125 Boardman St
- 5335 Shaw Ave
- 5027 Daggett Ave
- 5329 Pattison Ave
- 1711 Marconi Ave
- 4936 Shaw Ave
- 5632 Bischoff Ave
- 2205 Stephen Ave
- 5366 Magnolia Ave
- 4614 Shenandoah Ave
- 4615 Shenandoah Ave
- 6820 Magnolia Ave
- 5636 Columbia Ave
- 4935 Reber Place
- 4510 Cleveland Ave
- 5242 Wilson Ave
- 5236 Wilson Ave
- 5244 Wilson Ave
- 5234 Wilson Ave
- 5246 Wilson Ave
- 5228 Wilson Ave
- 5248 Wilson Ave
- 5226 Wilson Ave
- 5250 Wilson Ave
- 5222 Wilson Ave
- 5237 Bischoff Ave
- 5218 Wilson Ave
- 5243 Bischoff Ave
- 5245 Bischoff Ave
- 2118 Edwards St
- 5229 Bischoff Ave
- 5247 Bischoff Ave
- 5216 Wilson Ave
- 5225 Bischoff Ave
- 5239 Wilson Ave