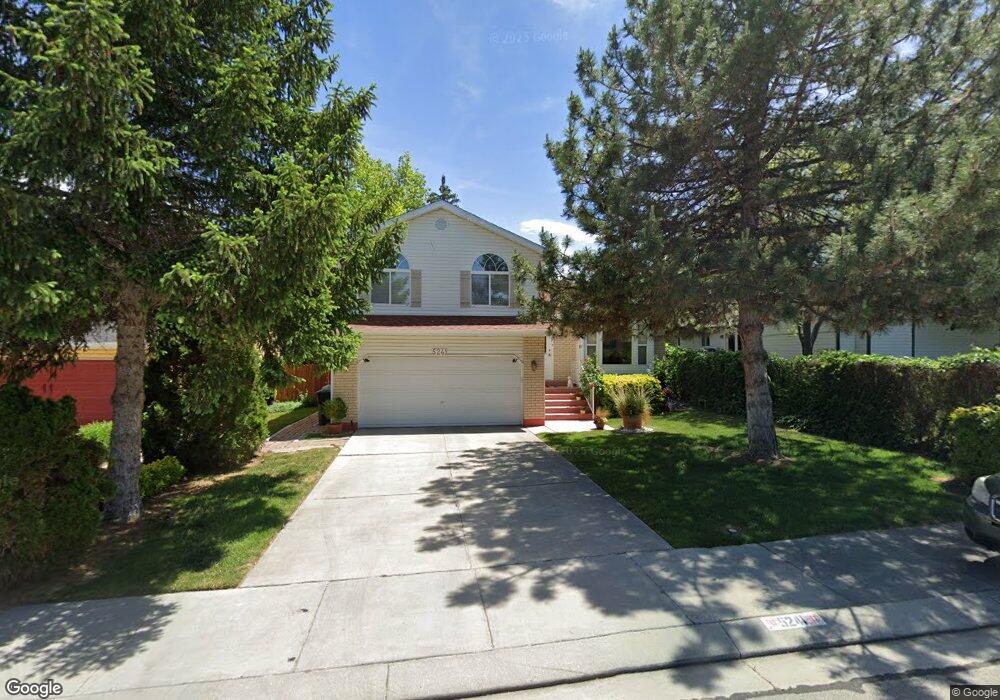
5241 Crus Corvi Rd West Jordan, UT 84081
Oquirrh NeighborhoodEstimated Value: $452,219 - $480,000
3
Beds
2
Baths
1,386
Sq Ft
$338/Sq Ft
Est. Value
About This Home
This home is located at 5241 Crus Corvi Rd, West Jordan, UT 84081 and is currently estimated at $467,805, approximately $337 per square foot. 5241 Crus Corvi Rd is a home located in Salt Lake County with nearby schools including Mountain Shadows School, West Hills Middle School, and Copper Hills High School.
Ownership History
Date
Name
Owned For
Owner Type
Purchase Details
Closed on
Feb 20, 2015
Sold by
Smith Carol Sue
Bought by
Smith Carol Sue and Smith Paul Ronald
Current Estimated Value
Purchase Details
Closed on
Mar 28, 2000
Sold by
Nicholls Steven K
Bought by
Nicholls Steven Kurt
Purchase Details
Closed on
Jan 6, 1999
Sold by
Standard Federal Bank
Bought by
Federal Home Loan Mortgage Corporation
Purchase Details
Closed on
Nov 20, 1998
Sold by
Villa Maximino and Torres Noe
Bought by
Allen Mtg Corp
Purchase Details
Closed on
Nov 14, 1994
Sold by
Wong Wayne
Bought by
Wong Mae
Purchase Details
Closed on
Oct 25, 1994
Sold by
Wong Wayne and Wong Mae M
Bought by
Wong Wayne and Wong Mae M
Purchase Details
Closed on
Jul 22, 1994
Sold by
Smith Carol S
Bought by
Smith Carol Sue
Create a Home Valuation Report for This Property
The Home Valuation Report is an in-depth analysis detailing your home's value as well as a comparison with similar homes in the area
Home Values in the Area
Average Home Value in this Area
Purchase History
| Date | Buyer | Sale Price | Title Company |
|---|---|---|---|
| Smith Carol Sue | -- | None Available | |
| Nicholls Steven Kurt | -- | First American Title | |
| Federal Home Loan Mortgage Corporation | -- | Backman Stewart Title Servic | |
| Allen Mtg Corp | -- | Backman Stewart Title Servic | |
| Wong Mae | -- | -- | |
| Wong Wayne | -- | -- | |
| Smith Carol Sue | -- | -- |
Source: Public Records
Mortgage History
| Date | Status | Borrower | Loan Amount |
|---|---|---|---|
| Closed | Allen Mtg Corp | -- |
Source: Public Records
Tax History Compared to Growth
Tax History
| Year | Tax Paid | Tax Assessment Tax Assessment Total Assessment is a certain percentage of the fair market value that is determined by local assessors to be the total taxable value of land and additions on the property. | Land | Improvement |
|---|---|---|---|---|
| 2025 | $2,517 | $450,800 | $97,800 | $353,000 |
| 2024 | $2,517 | $425,500 | $92,300 | $333,200 |
| 2023 | $2,451 | $400,400 | $88,700 | $311,700 |
| 2022 | $2,451 | $387,000 | $87,000 | $300,000 |
| 2021 | $2,148 | $314,800 | $66,900 | $247,900 |
| 2020 | $1,999 | $273,600 | $66,900 | $206,700 |
| 2019 | $1,940 | $259,700 | $63,100 | $196,600 |
| 2018 | $0 | $239,600 | $63,100 | $176,500 |
| 2017 | $1,747 | $227,400 | $63,100 | $164,300 |
| 2016 | $1,658 | $203,000 | $63,100 | $139,900 |
| 2015 | $1,507 | $178,000 | $62,900 | $115,100 |
| 2014 | -- | $170,500 | $61,100 | $109,400 |
Source: Public Records
Map
Nearby Homes
- 5281 Saguaro Dr
- 6839 S Cyclamen Dr
- 5183 W Cadenza Dr
- 6928 Beargrass Rd
- 6853 Mullien Dr Unit 5420
- 6706 Marshrock Rd
- 7758 S Iron Core Ln
- 7146 W Owens View Way Unit 204
- 7259 W Cibola Rd
- 5466 Ticklegrass Rd
- 6568 S 5180 W
- 4983 Shooting Star Ave
- 6635 S Milfoil Cir
- 7043 S Orion Hill Rd
- 7043 Orion Hill Rd
- 6922 Mullien Dr
- 7232 W Terraine Rd
- 7238 W Terraine Rd
- 7246 W Terraine Rd
- 5208 W Case Mountain Rd
- 5235 Crus Corvi Rd
- 6769 Sparrowtail Rd
- 6779 Sparrowtail Rd
- 5229 W Crus Corvi Rd
- 5229 Crus Corvi Rd
- 6772 Berula Cir
- 6772 S Berula Cir
- 6785 Sparrowtail Rd
- 6768 Berula Cir
- 5223 W Crus Corvi Rd
- 5242 Crus Corvi Rd
- 5223 Crus Corvi Rd
- 5242 W Crus Corvi Rd
- 5250 Crus Corvi Rd
- 5236 Crus Corvi Rd
- 5236 W Crus Corvi Rd
- 6768 S Berula Cir
- 6778 S Berula Cir
- 6772 Sparrowtail Rd
- 6778 Berula Cir