5242 Erwin St Maple Heights, OH 44137
Estimated Value: $117,853 - $128,000
3
Beds
1
Bath
1,206
Sq Ft
$101/Sq Ft
Est. Value
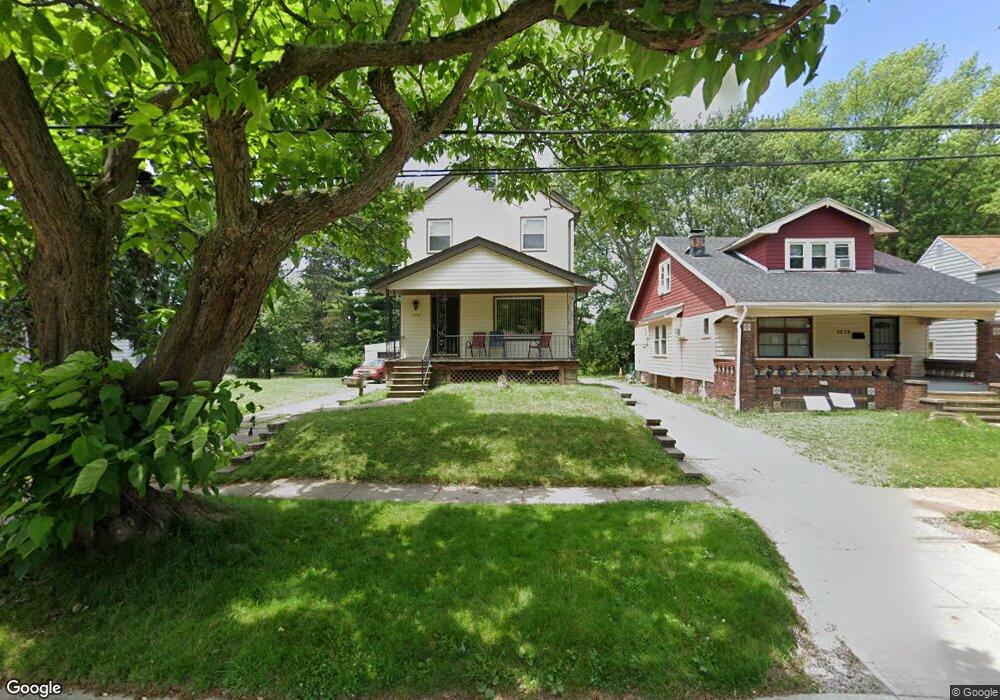
About This Home
This home is located at 5242 Erwin St, Maple Heights, OH 44137 and is currently estimated at $122,213, approximately $101 per square foot. 5242 Erwin St is a home located in Cuyahoga County with nearby schools including Abraham Lincoln Elementary School, Rockside/ J.F. Kennedy School, and Barack Obama School.
Ownership History
Date
Name
Owned For
Owner Type
Purchase Details
Closed on
Jul 17, 1997
Sold by
Craft Jeffrey T
Bought by
Frazier David M
Current Estimated Value
Home Financials for this Owner
Home Financials are based on the most recent Mortgage that was taken out on this home.
Original Mortgage
$69,700
Outstanding Balance
$8,151
Interest Rate
7.94%
Mortgage Type
New Conventional
Estimated Equity
$114,062
Purchase Details
Closed on
Oct 24, 1985
Sold by
Bernhardt Gary W and Bernhardt Chris R
Bought by
Craft Jeffrey T
Purchase Details
Closed on
Dec 7, 1982
Sold by
Randall Chris R
Bought by
Bernhardt Gary W and Bernhardt Chris R
Purchase Details
Closed on
Nov 4, 1977
Sold by
Penkal Charles J and Penkal Florence G
Bought by
Randall Chris R
Purchase Details
Closed on
Jan 1, 1975
Bought by
Penkal Charles J and Penkal Florence G
Create a Home Valuation Report for This Property
The Home Valuation Report is an in-depth analysis detailing your home's value as well as a comparison with similar homes in the area
Home Values in the Area
Average Home Value in this Area
Purchase History
| Date | Buyer | Sale Price | Title Company |
|---|---|---|---|
| Frazier David M | $82,000 | -- | |
| Craft Jeffrey T | $41,000 | -- | |
| Bernhardt Gary W | -- | -- | |
| Randall Chris R | $33,000 | -- | |
| Penkal Charles J | -- | -- |
Source: Public Records
Mortgage History
| Date | Status | Borrower | Loan Amount |
|---|---|---|---|
| Open | Frazier David M | $69,700 |
Source: Public Records
Tax History
| Year | Tax Paid | Tax Assessment Tax Assessment Total Assessment is a certain percentage of the fair market value that is determined by local assessors to be the total taxable value of land and additions on the property. | Land | Improvement |
|---|---|---|---|---|
| 2025 | $2,614 | $31,675 | $7,805 | $23,870 |
| 2024 | $2,899 | $31,675 | $7,805 | $23,870 |
| 2023 | $2,058 | $18,730 | $4,730 | $14,000 |
| 2022 | $2,050 | $18,725 | $4,725 | $14,000 |
| 2021 | $2,182 | $18,730 | $4,730 | $14,000 |
| 2020 | $1,871 | $14,180 | $3,570 | $10,610 |
| 2019 | $1,860 | $40,500 | $10,200 | $30,300 |
| 2018 | $1,758 | $14,180 | $3,570 | $10,610 |
| 2017 | $1,804 | $13,450 | $3,330 | $10,120 |
| 2016 | $1,746 | $13,450 | $3,330 | $10,120 |
| 2015 | $1,737 | $13,450 | $3,330 | $10,120 |
| 2014 | $1,737 | $14,770 | $3,640 | $11,130 |
Source: Public Records
Map
Nearby Homes
- 5234 Erwin St
- 18715 Libby Rd
- 5177 Cato St
- 5150 Arch St
- 5127 Erwin St
- 5341 Hollywood Ave
- 5100 Erwin St
- 5231 Philip Ave
- 18909 Maple Heights Blvd
- 5194 Homewood Ave
- 5246 Philip Ave
- 18840 Nitra Ave
- 5408 Oakwood Ave
- 18851 Raymond St
- 18990 Raymond St
- 17409 Mapleboro Ave
- 5165 Camden Rd
- 5031 Cato St
- 18217 Edinboro Ave
- 18915 Longview Ave
Your Personal Tour Guide
Ask me questions while you tour the home.