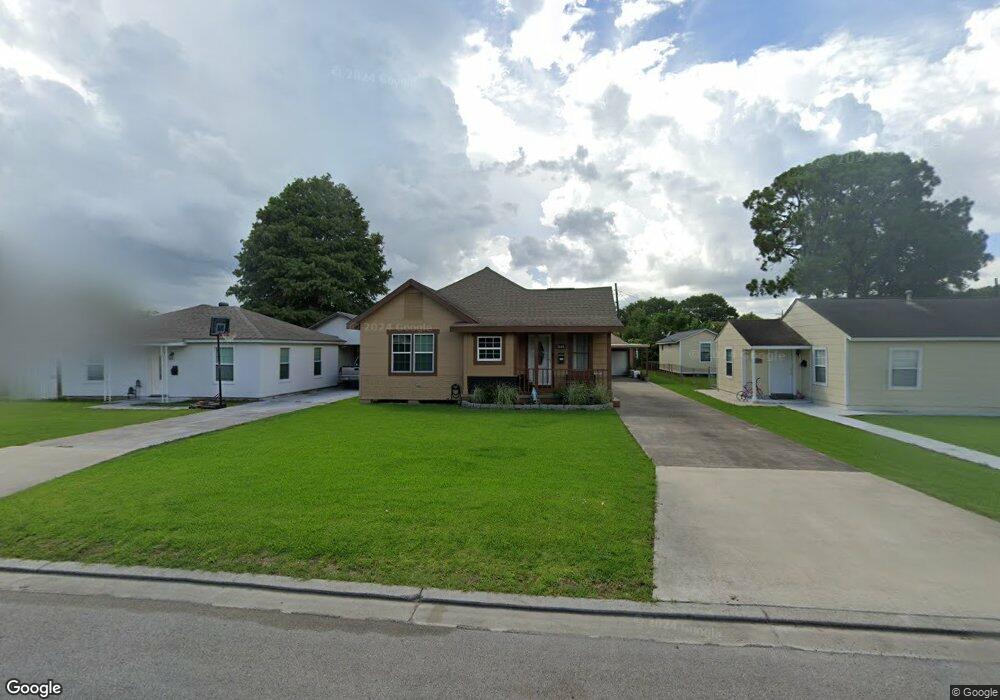
5245 4th St Port Arthur, TX 77642
Estimated Value: $97,000 - $127,000
--
Bed
--
Bath
1,344
Sq Ft
$83/Sq Ft
Est. Value
About This Home
This home is located at 5245 4th St, Port Arthur, TX 77642 and is currently estimated at $110,944, approximately $82 per square foot. 5245 4th St is a home located in Jefferson County with nearby schools including Travis Elementary School, Jefferson Middle School, and Memorial High School.
Ownership History
Date
Name
Owned For
Owner Type
Purchase Details
Closed on
Aug 16, 2016
Sold by
Thomas Terrie Fay
Bought by
Silva Jose Nicanor and Silva Maria
Current Estimated Value
Home Financials for this Owner
Home Financials are based on the most recent Mortgage that was taken out on this home.
Original Mortgage
$25,800
Interest Rate
3.41%
Mortgage Type
New Conventional
Purchase Details
Closed on
Jul 31, 2014
Sold by
Vandewerker Ruby Nell
Bought by
Thomas Terrie Fay
Purchase Details
Closed on
Apr 27, 2005
Sold by
Richard Vicki Hebert
Bought by
Vandewerker Ruby Nell
Create a Home Valuation Report for This Property
The Home Valuation Report is an in-depth analysis detailing your home's value as well as a comparison with similar homes in the area
Home Values in the Area
Average Home Value in this Area
Purchase History
| Date | Buyer | Sale Price | Title Company |
|---|---|---|---|
| Silva Jose Nicanor | -- | None Available | |
| Thomas Terrie Fay | -- | None Available | |
| Vandewerker Ruby Nell | -- | -- |
Source: Public Records
Mortgage History
| Date | Status | Borrower | Loan Amount |
|---|---|---|---|
| Closed | Silva Jose Nicanor | $25,800 |
Source: Public Records
Tax History Compared to Growth
Tax History
| Year | Tax Paid | Tax Assessment Tax Assessment Total Assessment is a certain percentage of the fair market value that is determined by local assessors to be the total taxable value of land and additions on the property. | Land | Improvement |
|---|---|---|---|---|
| 2025 | $1,441 | $108,180 | $6,750 | $101,430 |
| 2024 | $1,441 | $107,963 | $2,910 | $105,053 |
| 2023 | $1,441 | $97,095 | $2,910 | $94,185 |
| 2022 | $3,084 | $97,095 | $2,910 | $94,185 |
| 2021 | $2,694 | $81,298 | $2,910 | $78,388 |
| 2020 | $1,296 | $39,094 | $2,910 | $36,184 |
| 2019 | $1,267 | $39,090 | $2,910 | $36,180 |
| 2018 | $1,030 | $32,310 | $2,910 | $29,400 |
| 2017 | $1,001 | $32,310 | $2,910 | $29,400 |
| 2016 | $946 | $32,310 | $2,910 | $29,400 |
| 2015 | -- | $32,310 | $2,910 | $29,400 |
| 2014 | -- | $30,050 | $2,910 | $27,140 |
Source: Public Records
Map
Nearby Homes