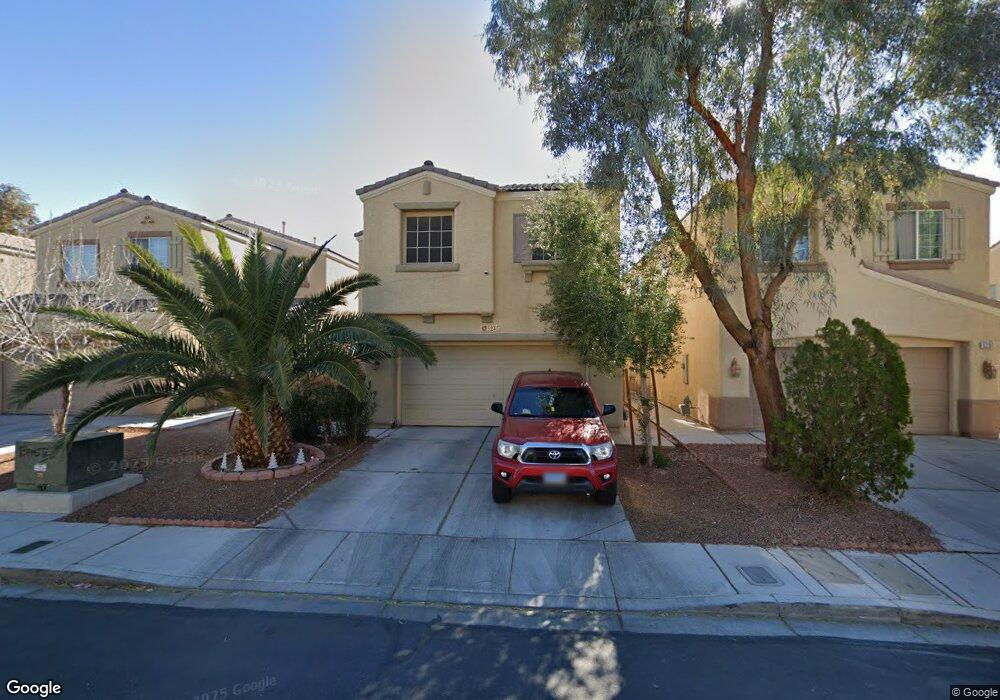
5245 Branch Ct Las Vegas, NV 89110
Estimated Value: $401,000 - $478,000
4
Beds
4
Baths
2,231
Sq Ft
$200/Sq Ft
Est. Value
About This Home
This home is located at 5245 Branch Ct, Las Vegas, NV 89110 and is currently estimated at $445,175, approximately $199 per square foot. 5245 Branch Ct is a home located in Clark County with nearby schools including Stanford Elementary School, Duane D. Keller Middle School, and Eldorado High School.
Ownership History
Date
Name
Owned For
Owner Type
Purchase Details
Closed on
Apr 20, 2009
Sold by
The Bank Of New York
Bought by
Cazas Javier and Cazas Marina C
Current Estimated Value
Home Financials for this Owner
Home Financials are based on the most recent Mortgage that was taken out on this home.
Original Mortgage
$132,554
Outstanding Balance
$82,755
Interest Rate
4.71%
Mortgage Type
FHA
Estimated Equity
$362,420
Purchase Details
Closed on
Aug 16, 2008
Sold by
Liv Cheer C
Bought by
The Bank Of New York and Jpmorgan Chase Bank Na
Purchase Details
Closed on
Dec 28, 2004
Sold by
Sunrise Residential Llc
Bought by
Liv Cherr C
Home Financials for this Owner
Home Financials are based on the most recent Mortgage that was taken out on this home.
Original Mortgage
$255,100
Interest Rate
6%
Mortgage Type
Unknown
Purchase Details
Closed on
Nov 18, 2003
Sold by
Kimball Hill Homes Nevada Inc
Bought by
Sunrise Residential Llc
Create a Home Valuation Report for This Property
The Home Valuation Report is an in-depth analysis detailing your home's value as well as a comparison with similar homes in the area
Home Values in the Area
Average Home Value in this Area
Purchase History
| Date | Buyer | Sale Price | Title Company |
|---|---|---|---|
| Cazas Javier | $135,000 | Old Republic Title Company O | |
| The Bank Of New York | $200,000 | Old Republic Title Co Of Nv | |
| Liv Cherr C | $318,910 | Nevada Title Company | |
| Sunrise Residential Llc | $2,337,000 | Nevada Title |
Source: Public Records
Mortgage History
| Date | Status | Borrower | Loan Amount |
|---|---|---|---|
| Open | Cazas Javier | $132,554 | |
| Previous Owner | Liv Cherr C | $255,100 | |
| Closed | Sunrise Residential Llc | $0 | |
| Closed | Sunrise Residential Llc | $800,000 | |
| Closed | Liv Cherr C | $63,700 |
Source: Public Records
Tax History Compared to Growth
Tax History
| Year | Tax Paid | Tax Assessment Tax Assessment Total Assessment is a certain percentage of the fair market value that is determined by local assessors to be the total taxable value of land and additions on the property. | Land | Improvement |
|---|---|---|---|---|
| 2025 | $1,732 | $118,313 | $26,600 | $91,713 |
| 2024 | $1,604 | $118,313 | $26,600 | $91,713 |
| 2023 | $1,068 | $117,326 | $30,800 | $86,526 |
| 2022 | $1,486 | $100,933 | $22,050 | $78,883 |
| 2021 | $1,376 | $93,478 | $21,000 | $72,478 |
| 2020 | $1,275 | $87,605 | $19,600 | $68,005 |
| 2019 | $1,194 | $80,771 | $16,100 | $64,671 |
| 2018 | $1,140 | $68,301 | $14,000 | $54,301 |
| 2017 | $2,044 | $69,707 | $14,000 | $55,707 |
| 2016 | $1,068 | $57,723 | $8,750 | $48,973 |
| 2015 | $1,065 | $46,572 | $5,250 | $41,322 |
| 2014 | $1,032 | $34,130 | $4,200 | $29,930 |
Source: Public Records
Map
Nearby Homes
- 1139 Betty Ln
- 5383 E Washington Ave
- 1385 Ringe Ln
- 4932 E Washington Ave
- 0 Washington Unit 2360795
- 5260 Carriellen Ln
- 4828 Lakestream Ave
- 730 N Christy Ln
- 4809 Sunny Brook Ave
- 5275 Hagemann Ln
- 5717 Christchurch Ave
- 4928 E Monroe Ave
- 656 N Christy Ln
- 5364 Awbury Ave
- 1112 Sandy Cove St
- 5529 Cedar Ave
- 4541 E Owens Ave
- 1345 Stokes St
- 5802 Queenstown Way
- 5754 Cinnabar Ave
- 5253 Branch Ct
- 5237 Branch Ct
- 5261 Branch Ct
- 1066 Leesburg St
- 1072 Leesburg St
- 1060 Leesburg St
- 5246 Randle Heights Ave
- 5254 Randle Heights Ave
- 1054 Leesburg St
- 5262 Randle Heights Ave
- 1059 Naylor Ct
- 1059 Naylor Ct
- 1059 Naylor Ct
- 1065 Naylor Ct
- 1048 Leesburg St
- 5248 Branch Ct
- 5240 Branch Ct
- 1051 Naylor Ct
- 5256 Branch Ct