Estimated Value: $487,000 - $564,000
3
Beds
2
Baths
1,374
Sq Ft
$375/Sq Ft
Est. Value
About This Home
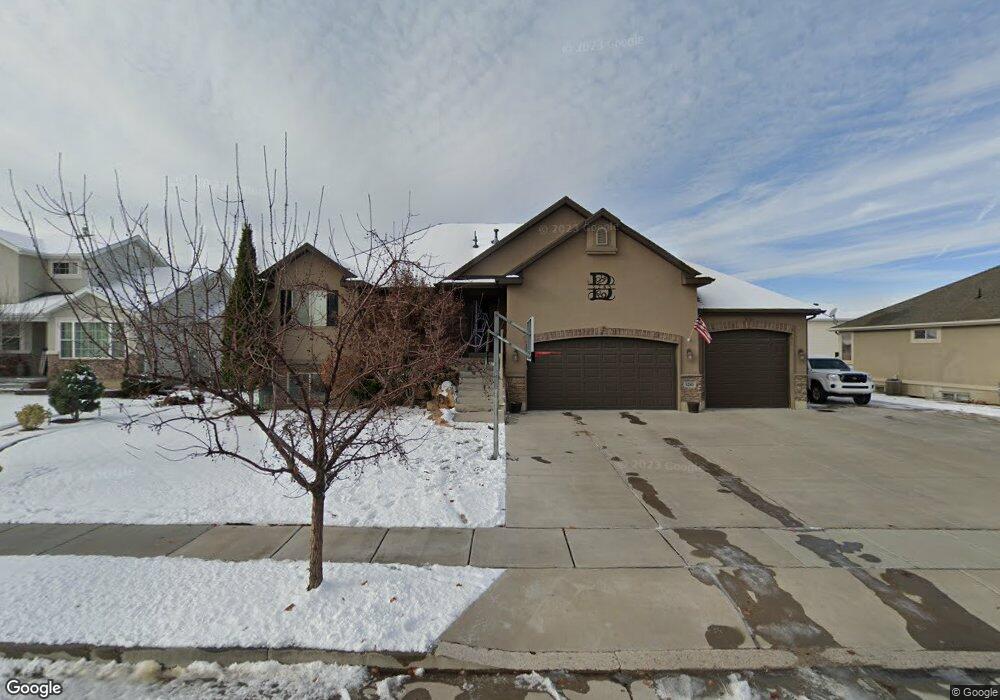
This home is located at 5245 S 3575 W Unit 63, Roy, UT 84067 and is currently estimated at $515,932, approximately $375 per square foot. 5245 S 3575 W Unit 63 is a home located in Weber County with nearby schools including Municipal School, Roy Junior High School, and Roy High School.
Ownership History
Date
Name
Owned For
Owner Type
Purchase Details
Closed on
Jul 27, 2020
Sold by
Bell Brad
Bought by
Bell Brad and Bell Hannah Le
Current Estimated Value
Home Financials for this Owner
Home Financials are based on the most recent Mortgage that was taken out on this home.
Original Mortgage
$230,000
Outstanding Balance
$184,281
Interest Rate
3.1%
Mortgage Type
New Conventional
Estimated Equity
$331,651
Purchase Details
Closed on
Apr 12, 2012
Sold by
Nilson And Company Inc
Bought by
Bell Brand
Home Financials for this Owner
Home Financials are based on the most recent Mortgage that was taken out on this home.
Original Mortgage
$173,100
Interest Rate
3.86%
Mortgage Type
Construction
Purchase Details
Closed on
Sep 20, 2010
Sold by
Northern Regal Homes Inc
Bought by
Nilson & Company Inc
Home Financials for this Owner
Home Financials are based on the most recent Mortgage that was taken out on this home.
Original Mortgage
$150,000
Interest Rate
4.38%
Mortgage Type
Purchase Money Mortgage
Create a Home Valuation Report for This Property
The Home Valuation Report is an in-depth analysis detailing your home's value as well as a comparison with similar homes in the area
Home Values in the Area
Average Home Value in this Area
Purchase History
| Date | Buyer | Sale Price | Title Company |
|---|---|---|---|
| Bell Brad | -- | Accommodation | |
| Bell Brand | -- | Bonneville Superior Title Co | |
| Nilson & Company Inc | -- | Executive Title Ogden |
Source: Public Records
Mortgage History
| Date | Status | Borrower | Loan Amount |
|---|---|---|---|
| Open | Bell Brad | $230,000 | |
| Closed | Bell Brand | $173,100 | |
| Previous Owner | Nilson & Company Inc | $150,000 |
Source: Public Records
Tax History Compared to Growth
Tax History
| Year | Tax Paid | Tax Assessment Tax Assessment Total Assessment is a certain percentage of the fair market value that is determined by local assessors to be the total taxable value of land and additions on the property. | Land | Improvement |
|---|---|---|---|---|
| 2025 | $3,135 | $505,050 | $175,003 | $330,047 |
| 2024 | $3,063 | $273,349 | $96,251 | $177,098 |
| 2023 | $3,145 | $282,700 | $93,410 | $189,290 |
| 2022 | $3,037 | $279,400 | $71,501 | $207,899 |
| 2021 | $2,755 | $420,000 | $85,012 | $334,988 |
| 2020 | $2,601 | $364,000 | $85,012 | $278,988 |
| 2019 | $2,504 | $330,000 | $69,160 | $260,840 |
| 2018 | $2,333 | $289,000 | $59,192 | $229,808 |
| 2017 | $2,228 | $259,000 | $56,253 | $202,747 |
| 2016 | $2,234 | $140,298 | $29,922 | $110,376 |
| 2015 | $1,898 | $121,043 | $24,169 | $96,874 |
| 2014 | $1,776 | $111,239 | $24,169 | $87,070 |
Source: Public Records
Map
Nearby Homes
- 3607 W 5400 S
- 3766 W 5300 S
- 3443 W 5200 S Unit 2&3
- 3820 Foxglen Dr
- 5235 Midland Dr
- 3509 W 4835 S Unit 26
- Poplar Plan at Highgate Cove
- Pando Plan at Highgate Cove
- 5578 S 3450 W
- 4964 S 3375 W
- 3523 W 4835 S Unit 28
- 3524 W 4835 S Unit 22
- 3832 W 5625 S
- 3809 W 5625 S
- 5321 S 3100 W
- 5465 S 4050 W
- 5432 S 3150 W
- 4021 W 5000 S
- 3826 W 5750 S
- 5538 S 3150 W