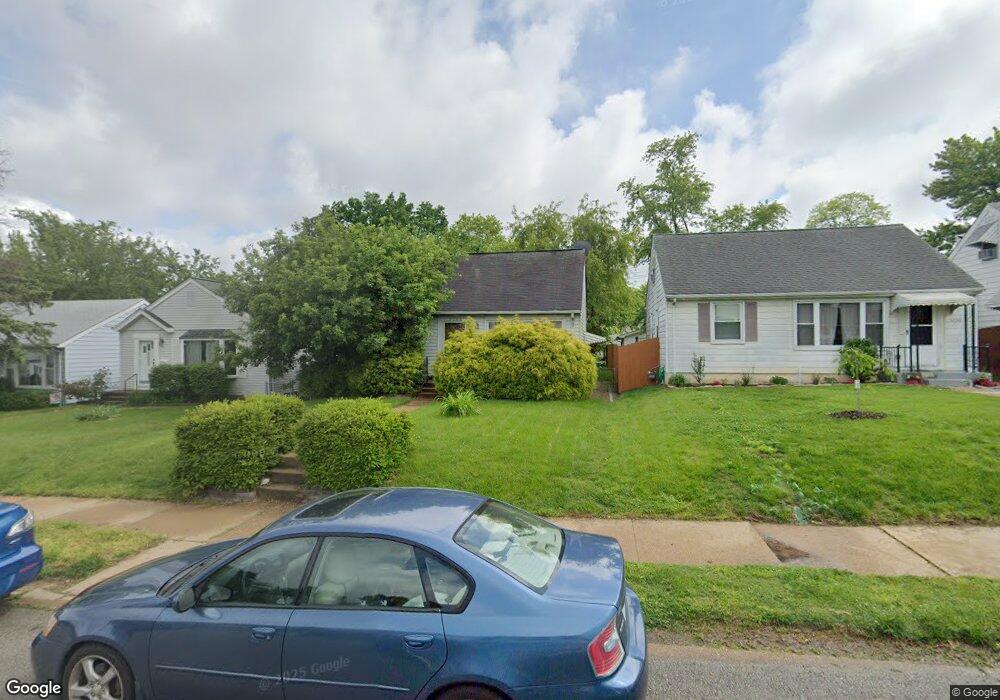
5246 Parker Ave Saint Louis, MO 63139
Northampton NeighborhoodEstimated Value: $124,000 - $203,000
--
Bed
1
Bath
1,560
Sq Ft
$109/Sq Ft
Est. Value
About This Home
This home is located at 5246 Parker Ave, Saint Louis, MO 63139 and is currently estimated at $169,647, approximately $108 per square foot. 5246 Parker Ave is a home located in St. Louis City with nearby schools including Mason Elementary School, Long International Middle School, and Roosevelt High School.
Ownership History
Date
Name
Owned For
Owner Type
Purchase Details
Closed on
Sep 27, 2022
Sold by
Wall and Myto
Bought by
Butler Scott and Butler Maki
Current Estimated Value
Home Financials for this Owner
Home Financials are based on the most recent Mortgage that was taken out on this home.
Original Mortgage
$97,000
Outstanding Balance
$92,714
Interest Rate
5.13%
Mortgage Type
New Conventional
Estimated Equity
$76,933
Purchase Details
Closed on
May 20, 2005
Sold by
Tockman Linda and Nichols Tony R
Bought by
Duong Myto
Home Financials for this Owner
Home Financials are based on the most recent Mortgage that was taken out on this home.
Original Mortgage
$137,900
Interest Rate
5.75%
Mortgage Type
Fannie Mae Freddie Mac
Purchase Details
Closed on
Jan 29, 2003
Sold by
Nichols Tony
Bought by
Tockman Linda and Nichols Tony
Purchase Details
Closed on
Aug 29, 2001
Sold by
Zwieselbauer Patricia E
Bought by
Nichols Tony R
Home Financials for this Owner
Home Financials are based on the most recent Mortgage that was taken out on this home.
Original Mortgage
$81,498
Interest Rate
6.98%
Mortgage Type
Purchase Money Mortgage
Create a Home Valuation Report for This Property
The Home Valuation Report is an in-depth analysis detailing your home's value as well as a comparison with similar homes in the area
Home Values in the Area
Average Home Value in this Area
Purchase History
| Date | Buyer | Sale Price | Title Company |
|---|---|---|---|
| Butler Scott | -- | -- | |
| Duong Myto | -- | -- | |
| Tockman Linda | -- | -- | |
| Nichols Tony R | -- | -- |
Source: Public Records
Mortgage History
| Date | Status | Borrower | Loan Amount |
|---|---|---|---|
| Open | Butler Scott | $97,000 | |
| Previous Owner | Duong Myto | $137,900 | |
| Previous Owner | Nichols Tony R | $81,498 |
Source: Public Records
Tax History Compared to Growth
Tax History
| Year | Tax Paid | Tax Assessment Tax Assessment Total Assessment is a certain percentage of the fair market value that is determined by local assessors to be the total taxable value of land and additions on the property. | Land | Improvement |
|---|---|---|---|---|
| 2025 | $2,132 | $30,090 | $2,660 | $27,430 |
| 2024 | $2,029 | $25,140 | $2,660 | $22,480 |
| 2023 | $2,029 | $25,140 | $2,660 | $22,480 |
| 2022 | $1,922 | $22,910 | $2,660 | $20,250 |
| 2021 | $1,919 | $22,910 | $2,660 | $20,250 |
| 2020 | $1,754 | $21,070 | $2,660 | $18,410 |
| 2019 | $1,748 | $21,070 | $2,660 | $18,410 |
| 2018 | $1,572 | $18,340 | $1,900 | $16,440 |
| 2017 | $1,546 | $18,340 | $1,900 | $16,440 |
| 2016 | $1,404 | $16,420 | $1,900 | $14,520 |
| 2015 | $1,274 | $16,420 | $1,900 | $14,520 |
| 2014 | $1,276 | $16,420 | $1,900 | $14,520 |
| 2013 | -- | $16,450 | $1,900 | $14,550 |
Source: Public Records
Map
Nearby Homes
- 5210 Parker Ave
- 5273 Parker Ave
- 5050 Potomac St
- 3443 Sublette Ave
- 5065 Miami St
- 5531 Arthur Ave
- 5425 Pernod Ave
- 7082 Oleatha Ave
- 4959 Fairview Ave
- 4960 Fyler Ave
- 5329 Tholozan Ave
- 3244 Regal Place
- 5340 Tholozan Ave
- 5630 Fyler Ave
- 5410 Tholozan Ave
- 5200 Mardel Ave
- 3501 Lawn Ave
- 5056 Lindenwood Ave
- 5052 Lindenwood Ave
- 5044 Lindenwood Ave
- 5242 Parker Ave
- 5250 Parker Ave
- 5238 Parker Ave
- 5254 Parker Ave
- 5234 Parker Ave
- 5258 Parker Ave
- 5245 Fairview Ave
- 5241 Fairview Ave
- 5262 Parker Ave
- 5249 Fairview Ave
- 5230 Parker Ave
- 5237 Fairview Ave
- 5253 Fairview Ave
- 5233 Fairview Ave
- 5245 Parker Ave
- 5249 Parker Ave
- 5257 Fairview Ave
- 5241 Parker Ave
- 5226 Parker Ave
- 5253 Parker Ave