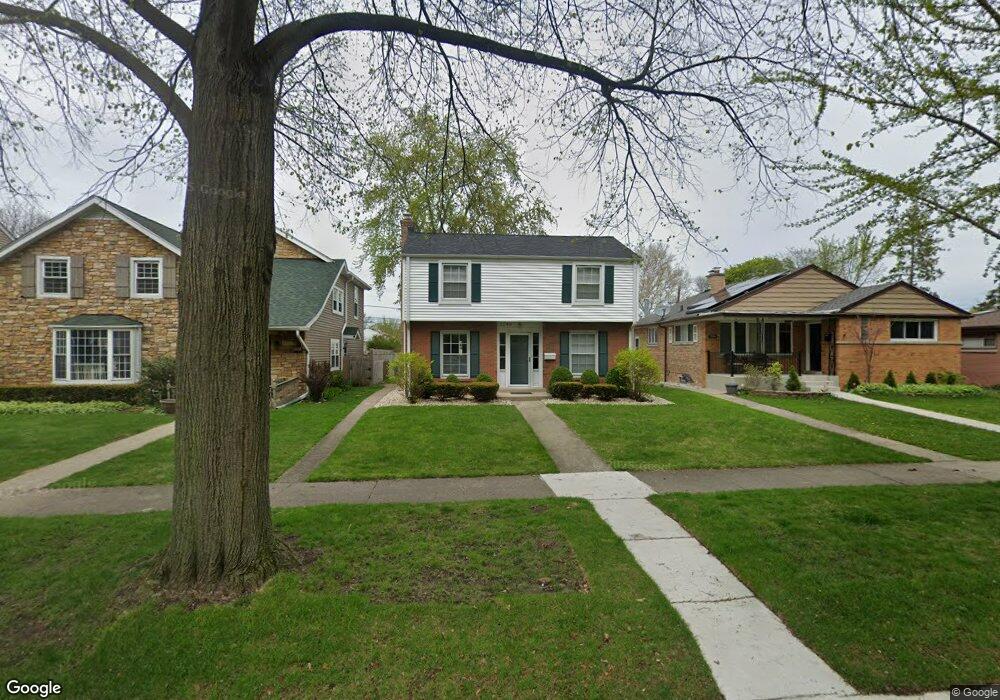
5248 Suffield Terrace Skokie, IL 60077
Southwest Skokie NeighborhoodEstimated Value: $452,000 - $619,000
4
Beds
3
Baths
2,185
Sq Ft
$246/Sq Ft
Est. Value
About This Home
This home is located at 5248 Suffield Terrace, Skokie, IL 60077 and is currently estimated at $538,228, approximately $246 per square foot. 5248 Suffield Terrace is a home located in Cook County with nearby schools including Old Orchard Jr High School, Jane Stenson School, and Niles North High School.
Ownership History
Date
Name
Owned For
Owner Type
Purchase Details
Closed on
Sep 2, 2020
Sold by
Hogan Daniel L and Priore Katherine A
Bought by
Hogan Daniel J and Priore Katherine A
Current Estimated Value
Purchase Details
Closed on
Apr 24, 2015
Sold by
Soffer Robert G
Bought by
Hogan Daniel J and Priore Katherine A
Home Financials for this Owner
Home Financials are based on the most recent Mortgage that was taken out on this home.
Original Mortgage
$285,200
Outstanding Balance
$220,585
Interest Rate
3.87%
Mortgage Type
New Conventional
Estimated Equity
$317,643
Purchase Details
Closed on
Oct 8, 2006
Sold by
Crosley Mark and Cohen Sheila B
Bought by
Soffer Robert G
Home Financials for this Owner
Home Financials are based on the most recent Mortgage that was taken out on this home.
Original Mortgage
$288,000
Interest Rate
6.5%
Mortgage Type
Adjustable Rate Mortgage/ARM
Create a Home Valuation Report for This Property
The Home Valuation Report is an in-depth analysis detailing your home's value as well as a comparison with similar homes in the area
Home Values in the Area
Average Home Value in this Area
Purchase History
| Date | Buyer | Sale Price | Title Company |
|---|---|---|---|
| Hogan Daniel J | -- | Attorney | |
| Hogan Daniel J | $356,500 | First American Title Ins Co | |
| Soffer Robert G | $360,000 | Chicago Title Insurance Co | |
| Soffer Robert G | $360,000 | Chicago Title Insurance Co |
Source: Public Records
Mortgage History
| Date | Status | Borrower | Loan Amount |
|---|---|---|---|
| Open | Hogan Daniel J | $285,200 | |
| Previous Owner | Soffer Robert G | $288,000 |
Source: Public Records
Tax History Compared to Growth
Tax History
| Year | Tax Paid | Tax Assessment Tax Assessment Total Assessment is a certain percentage of the fair market value that is determined by local assessors to be the total taxable value of land and additions on the property. | Land | Improvement |
|---|---|---|---|---|
| 2024 | $9,494 | $41,317 | $6,851 | $34,466 |
| 2023 | $9,215 | $41,317 | $6,851 | $34,466 |
| 2022 | $9,215 | $41,317 | $6,851 | $34,466 |
| 2021 | $7,301 | $30,007 | $4,216 | $25,791 |
| 2020 | $7,291 | $30,007 | $4,216 | $25,791 |
| 2019 | $8,307 | $33,716 | $4,216 | $29,500 |
| 2018 | $10,162 | $37,722 | $3,820 | $33,902 |
| 2017 | $10,236 | $37,722 | $3,820 | $33,902 |
| 2016 | $9,786 | $37,722 | $3,820 | $33,902 |
| 2015 | $7,351 | $26,336 | $3,293 | $23,043 |
| 2014 | $4,039 | $14,814 | $3,293 | $11,521 |
| 2013 | -- | $26,336 | $3,293 | $23,043 |
Source: Public Records
Map
Nearby Homes
- 5346 Suffield Terrace
- 5247 Suffield Ct
- 5317 Suffield Ct
- 5352 Greenwood St
- 8950 Lavergne Ave
- 5536 Greenwood St
- 8717 Gross Point Rd
- 9011 Bronx Ave
- 9012 Lamon Ave
- 8836 Bronx Ave
- 5309 Crain St
- 8940 Lamon Ave
- 9234 Central Ave
- 5032 Crain St
- 8655 Harms Rd
- 8914 La Crosse Ave Unit 2S
- 4801 Grove St
- 9508 Leamington Ave
- 8708 Central Ave
- 5644 Lyons St
- 5248 Suffield Terrace
- 5252 Suffield Terrace
- 5244 Suffield Terrace
- 5238 Suffield Terrace
- 5256 Suffield Terrace
- 5234 Suffield Terrace
- 5255 Suffield Terrace
- 5249 Davis St
- 5245 Davis St
- 5253 Davis St
- 5230 Suffield Terrace
- 5241 Davis St
- 5245 Suffield Terrace
- 9055 Lockwood Ave
- 5235 Suffield Terrace
- 9040 Lockwood Ave
- 5237 Davis St
- 5237 Davis St
- 5228 Suffield Terrace
- 5233 Davis St