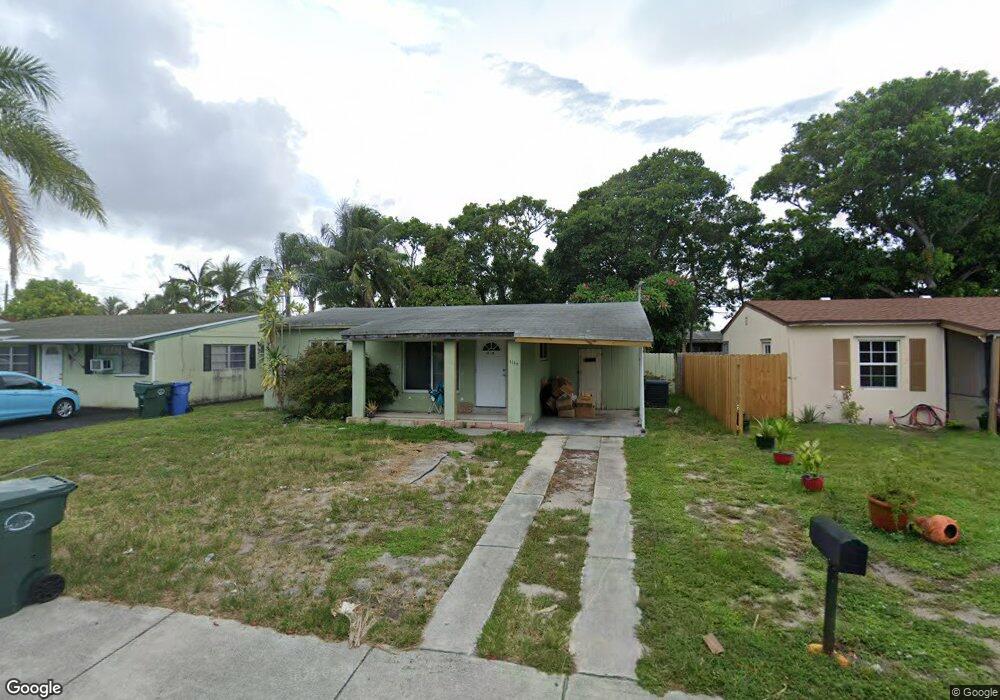
5249 N Andrews Ave Fort Lauderdale, FL 33309
North Andrews Gardens NeighborhoodEstimated Value: $366,000 - $419,000
2
Beds
1
Bath
856
Sq Ft
$448/Sq Ft
Est. Value
About This Home
This home is located at 5249 N Andrews Ave, Fort Lauderdale, FL 33309 and is currently estimated at $383,151, approximately $447 per square foot. 5249 N Andrews Ave is a home located in Broward County with nearby schools including North Andrews Gardens Elementary School, James S. Rickards Middle School, and Northeast High School.
Ownership History
Date
Name
Owned For
Owner Type
Purchase Details
Closed on
Feb 4, 2015
Sold by
Mango 1000 Llc
Bought by
Dahab Family Revocable Trust
Current Estimated Value
Purchase Details
Closed on
Feb 14, 2012
Sold by
Diab Diae M and Dahan Najla M
Bought by
Mango 1000 Llc
Purchase Details
Closed on
Jun 27, 2011
Sold by
Fannie Mae
Bought by
Diab Diae M and Dahan Najla M
Purchase Details
Closed on
Jan 10, 2011
Sold by
Citimortgage Inc
Bought by
Federal National Mortgage Association
Purchase Details
Closed on
Jun 7, 2010
Sold by
Dunlop Robert B and Price Patricia
Bought by
Citimortgage Inc
Purchase Details
Closed on
Jul 25, 1997
Sold by
Flynn Mark J and Flynn Susan
Bought by
Dunlop Robert B
Home Financials for this Owner
Home Financials are based on the most recent Mortgage that was taken out on this home.
Original Mortgage
$60,700
Interest Rate
7.7%
Mortgage Type
FHA
Create a Home Valuation Report for This Property
The Home Valuation Report is an in-depth analysis detailing your home's value as well as a comparison with similar homes in the area
Home Values in the Area
Average Home Value in this Area
Purchase History
| Date | Buyer | Sale Price | Title Company |
|---|---|---|---|
| Dahab Family Revocable Trust | -- | Attorney | |
| Mango 1000 Llc | -- | Attorney | |
| Diab Diae M | $58,800 | Attorney | |
| Federal National Mortgage Association | -- | Consumer Title & Escrow Serv | |
| Citimortgage Inc | $62,600 | None Available | |
| Dunlop Robert B | $66,100 | -- |
Source: Public Records
Mortgage History
| Date | Status | Borrower | Loan Amount |
|---|---|---|---|
| Previous Owner | Dunlop Robert B | $60,700 |
Source: Public Records
Tax History Compared to Growth
Tax History
| Year | Tax Paid | Tax Assessment Tax Assessment Total Assessment is a certain percentage of the fair market value that is determined by local assessors to be the total taxable value of land and additions on the property. | Land | Improvement |
|---|---|---|---|---|
| 2025 | $6,656 | $270,110 | -- | -- |
| 2024 | $6,102 | $270,110 | -- | -- |
| 2023 | $6,102 | $223,240 | $0 | $0 |
| 2022 | $5,687 | $202,950 | $0 | $0 |
| 2021 | $4,427 | $184,500 | $0 | $0 |
| 2020 | $4,035 | $179,340 | $36,900 | $142,440 |
| 2019 | $3,777 | $177,270 | $36,900 | $140,370 |
| 2018 | $3,336 | $149,190 | $36,900 | $112,290 |
| 2017 | $3,134 | $126,030 | $0 | $0 |
| 2016 | $2,886 | $114,580 | $0 | $0 |
| 2015 | $2,495 | $90,750 | $0 | $0 |
| 2014 | $2,360 | $82,500 | $0 | $0 |
| 2013 | -- | $75,000 | $28,990 | $46,010 |
Source: Public Records
Map
Nearby Homes
- 5324 NW 1st Ave
- 5409 N Andrews Ave
- 121 NW 53rd Ct
- 5348 NE 1st Terrace
- 5161 N Andrews Ave
- 230 NW 52nd Ct
- 5456 NW 1st Ave
- 5400 NE 2nd Ave
- 230 NW 55th St
- 20 NW 56th St
- 410 NW 52nd St
- 200 NE 56th St
- 5216 NE 3rd Ave
- 260 NE 51st Ct
- 241 NE 55th St
- 341 NW 55th St
- 5409 NE 4th Ave
- 390 NE 51st Ct
- 377 NW 49th St
- 221 NE 57th St
- 5273 N Andrews Ave
- 5257 N Andrews Ave
- 5281 N Andrews Ave
- 5265 N Andrews Ave
- 5289 N Andrews Ave
- 5272 NW 1st Ave
- 5280 NW 1st Ave
- 5264 NW 1st Ave
- 5288 NW 1st Ave
- 5256 NW 1st Ave
- 5297 N Andrews Ave
- 5296 NW 1st Ave
- 5264 N Andrews Ave
- 5248 NW 1st Ave
- 5288 N Andrews Ave
- 5301 N Andrews Ave
- 5241 N Andrews Ave
- 5256 N Andrews Ave
- 5296 N Andrews Ave