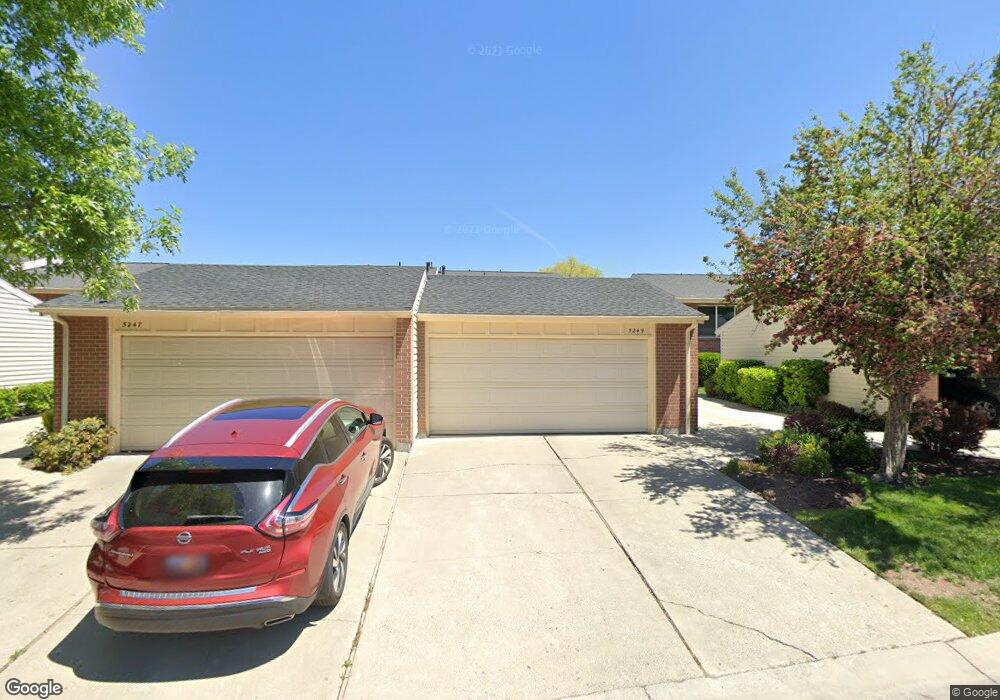
5249 S Spring House Ln Unit G5 Salt Lake City, UT 84107
Estimated Value: $448,000 - $488,000
3
Beds
3
Baths
1,800
Sq Ft
$262/Sq Ft
Est. Value
About This Home
This home is located at 5249 S Spring House Ln Unit G5, Salt Lake City, UT 84107 and is currently estimated at $470,745, approximately $261 per square foot. 5249 S Spring House Ln Unit G5 is a home located in Salt Lake County with nearby schools including Parkside Elementary School, Hillcrest Junior High School, and Murray High School.
Ownership History
Date
Name
Owned For
Owner Type
Purchase Details
Closed on
Oct 4, 2024
Sold by
Aratari Joseph and Aratari William
Bought by
Robinson Carole
Current Estimated Value
Purchase Details
Closed on
Apr 12, 2023
Sold by
Aratari Joseph
Bought by
Aratari Joseph and Aratari William
Home Financials for this Owner
Home Financials are based on the most recent Mortgage that was taken out on this home.
Original Mortgage
$395,000
Interest Rate
6.65%
Mortgage Type
New Conventional
Purchase Details
Closed on
Feb 7, 2012
Sold by
Sanders Heidi R
Bought by
Kronawitter Ann
Purchase Details
Closed on
Jan 28, 1994
Sold by
Sanders Heidi R and Wynn Heidi S
Bought by
Sanders Heidi R
Create a Home Valuation Report for This Property
The Home Valuation Report is an in-depth analysis detailing your home's value as well as a comparison with similar homes in the area
Home Values in the Area
Average Home Value in this Area
Purchase History
| Date | Buyer | Sale Price | Title Company |
|---|---|---|---|
| Robinson Carole | -- | Oasis Title | |
| Aratari Joseph | -- | First American Title Insurance | |
| Aratarl Joseph | -- | Us Title | |
| Kronawitter Ann | -- | First American Title | |
| Sanders Heidi R | -- | -- |
Source: Public Records
Mortgage History
| Date | Status | Borrower | Loan Amount |
|---|---|---|---|
| Previous Owner | Aratarl Joseph | $395,000 |
Source: Public Records
Tax History Compared to Growth
Tax History
| Year | Tax Paid | Tax Assessment Tax Assessment Total Assessment is a certain percentage of the fair market value that is determined by local assessors to be the total taxable value of land and additions on the property. | Land | Improvement |
|---|---|---|---|---|
| 2025 | $2,015 | $470,700 | $141,200 | $329,500 |
| 2024 | $2,015 | $446,800 | $134,000 | $312,800 |
| 2023 | $1,841 | $391,000 | $117,300 | $273,700 |
| 2022 | $1,690 | $341,400 | $102,400 | $239,000 |
| 2021 | $1,367 | $243,400 | $73,000 | $170,400 |
| 2020 | $1,650 | $278,100 | $83,400 | $194,700 |
| 2019 | $1,610 | $262,100 | $78,600 | $183,500 |
| 2018 | $1,437 | $238,800 | $71,600 | $167,200 |
| 2017 | $1,260 | $211,100 | $63,300 | $147,800 |
| 2016 | $1,259 | $203,600 | $61,100 | $142,500 |
| 2015 | $1,319 | $193,700 | $58,100 | $135,600 |
| 2014 | $1,317 | $191,800 | $57,500 | $134,300 |
Source: Public Records
Map
Nearby Homes
- 572 E 5300 S
- 5320 S 570 E Unit L
- 5330 S 590 E Unit G
- 5130 Caribbean Way
- 5323 S 560 E Unit D
- 5327 S 560 E Unit F
- 619 E 5400 S
- 415 E Creekside Cir Unit B
- 450 E Creekside Cir Unit B
- 440 E Creekside Cir Unit D
- 426 E Creekside Cir Unit E
- 5423 S Tonalea Dr
- 5402 S Willow Ln Unit F
- 5420 S Willow Ln Unit D
- 725 E Three Fountains Cir Unit 57
- 745 E Three Fountains Cir Unit 41
- 5461 S Willow Ln
- 622 Lincoln Place
- 5508 S Willow Ln
- 832 E Three Fountains Dr Unit 182
- 5249 Spring House Ln
- 5251 S Spring House Ln Unit G-6
- 5247 Spring House Ln
- 5251 Spring House Ln
- 5245 Spring House Ln
- 5253 Spring House Ln
- 5243 Spring House Ln
- 5243 S Spring House Ln
- 5255 Spring House Ln
- 5241 Spring House Ln
- 5241 S Spring House Ln
- 637 Spring Hill Dr
- 631 E Spring Hill Dr
- 5261 Spring House Ln Unit H1
- 641 Spring Hill Dr Unit B2
- 641 E Spring Hill Dr Unit B-2
- 641 E Spring Hill Dr
- 640 E Spring House Ln
- 627 Spring Hill Dr
- 640 Spring House Ln