Estimated Value: $402,401 - $447,000
1
Bed
1
Bath
633
Sq Ft
$668/Sq Ft
Est. Value
About This Home
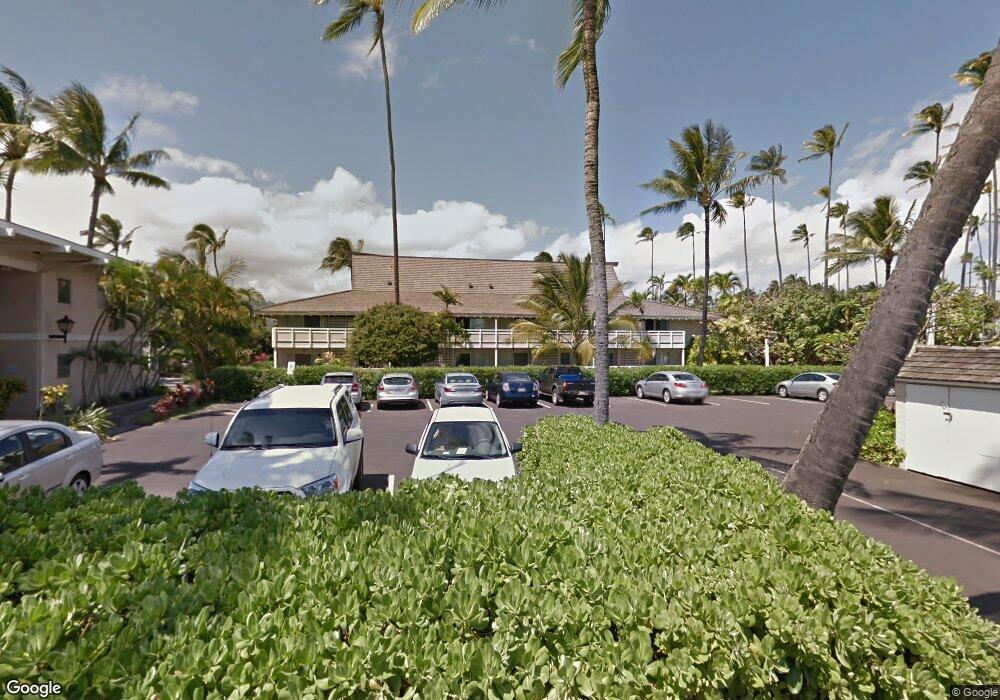
This home is located at 525 Aleka Loop Unit K1, Kapaa, HI 96746 and is currently estimated at $422,600, approximately $667 per square foot. 525 Aleka Loop Unit K1 is a home located in Kauai County with nearby schools including Kapa'a Elementary School, Kapa'a Middle School, and Kapa'a High School.
Ownership History
Date
Name
Owned For
Owner Type
Purchase Details
Closed on
Jul 27, 2012
Sold by
American Savings Bank Fsb
Bought by
Smith Lonnie Brarily and Smith Mary Lynn
Current Estimated Value
Purchase Details
Closed on
Jun 10, 2011
Sold by
Tobin Timothy
Bought by
American Savings Bank F S B
Purchase Details
Closed on
Nov 22, 2006
Sold by
Mandel Henry Royal and Mandel Ruth Eileen
Bought by
Rickards Raymond Robert and Rickards Brenda Lynn
Home Financials for this Owner
Home Financials are based on the most recent Mortgage that was taken out on this home.
Original Mortgage
$152,500
Interest Rate
6.38%
Mortgage Type
Purchase Money Mortgage
Purchase Details
Closed on
Oct 6, 2003
Sold by
Wistrom Tore and Wistrom Kirsti
Bought by
Mandel Henry Royal and Mandel Ruth Eileen
Create a Home Valuation Report for This Property
The Home Valuation Report is an in-depth analysis detailing your home's value as well as a comparison with similar homes in the area
Home Values in the Area
Average Home Value in this Area
Purchase History
| Date | Buyer | Sale Price | Title Company |
|---|---|---|---|
| Smith Lonnie Brarily | $69,000 | Tg | |
| American Savings Bank F S B | $106,950 | Or | |
| Rickards Raymond Robert | $252,533 | Tg | |
| Mandel Henry Royal | $140,000 | -- |
Source: Public Records
Mortgage History
| Date | Status | Borrower | Loan Amount |
|---|---|---|---|
| Previous Owner | Rickards Raymond Robert | $152,500 |
Source: Public Records
Tax History
| Year | Tax Paid | Tax Assessment Tax Assessment Total Assessment is a certain percentage of the fair market value that is determined by local assessors to be the total taxable value of land and additions on the property. | Land | Improvement |
|---|---|---|---|---|
| 2025 | $150 | $195,700 | -- | $195,700 |
| 2024 | $150 | $190,000 | -- | $190,000 |
| 2023 | $150 | $184,500 | $0 | $184,500 |
| 2022 | $150 | $179,100 | $0 | $0 |
| 2021 | $150 | $173,900 | $0 | $0 |
| 2020 | $150 | $168,800 | $0 | $168,800 |
| 2019 | $150 | $163,900 | $0 | $163,900 |
| 2018 | $150 | $159,100 | $0 | $0 |
| 2017 | $150 | $154,500 | $0 | $0 |
| 2016 | $150 | $159,300 | $0 | $0 |
| 2015 | $980 | $166,800 | $0 | $0 |
| 2014 | $980 | $112,500 | $0 | $0 |
Source: Public Records
Map
Nearby Homes
- 525 Aleka Loop Unit K3
- 525 Aleka Loop Unit G5
- 525 Aleka Loop Unit K8
- 525 Aleka Loop Unit A16
- 525 Aleka Loop Unit A12
- 525 Aleka Loop Unit D5
- 00 Aleka Loop
- 440 Aleka Place Unit 256
- 440 Aleka Place Unit 118
- 440 Aleka Place Unit 142
- 440 Aleka Place Unit 156
- 4461 Kamoa Rd Unit F11
- 4461 Kamoa Rd Unit D12
- 410 Papaloa Rd Unit 316
- 410 Papaloa Rd Unit 233
- 410 Papaloa Rd Unit 211
- 380 Papaloa Rd Unit 2
- 4-820 Kuhio Hwy Unit F202
- 4-820 Kuhio Hwy Unit C102
- 4-820 Kuhio Hwy Unit C402
- 525 Aleka Loop Unit K4
- 525 Aleka Loop Unit D10
- 525 Aleka Loop Unit B10
- 525 Aleka Loop Unit B8
- 525 Aleka Loop Unit B4
- 525 Aleka Loop Unit K16
- 525 Aleka Loop Unit K15
- 525 Aleka Loop Unit K14
- 525 Aleka Loop Unit K13
- 525 Aleka Loop Unit K11
- 525 Aleka Loop Unit K10
- 525 Aleka Loop Unit K9
- 525 Aleka Loop Unit K7
- 525 Aleka Loop Unit K6
- 525 Aleka Loop Unit K5
- 525 Aleka Loop Unit K2
- 525 Aleka Loop Unit J16
- 525 Aleka Loop Unit J15
- 525 Aleka Loop Unit J14
- 525 Aleka Loop Unit J13
Your Personal Tour Guide
Ask me questions while you tour the home.