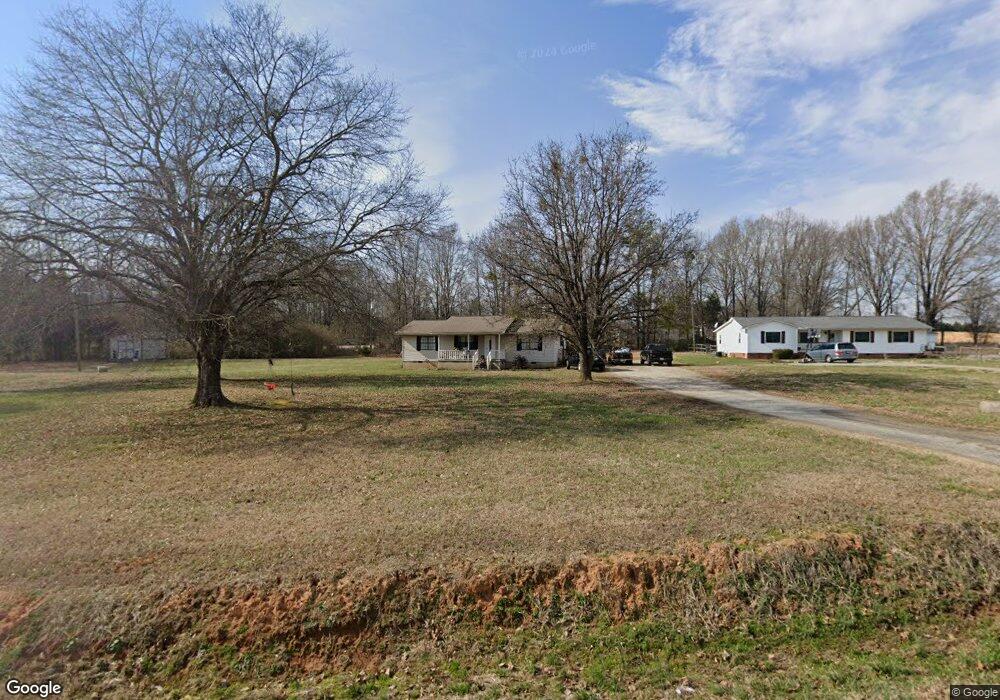
525 Bens Creek Rd Woodruff, SC 29388
Estimated Value: $216,000 - $308,000
3
Beds
2
Baths
1,352
Sq Ft
$190/Sq Ft
Est. Value
About This Home
This home is located at 525 Bens Creek Rd, Woodruff, SC 29388 and is currently estimated at $257,128, approximately $190 per square foot. 525 Bens Creek Rd is a home located in Spartanburg County with nearby schools including Woodruff Primary School, Woodruff Elementary School, and Woodruff Middle School.
Ownership History
Date
Name
Owned For
Owner Type
Purchase Details
Closed on
Feb 8, 2019
Sold by
Jones Willie F and Jones Tonya F
Bought by
Jones Frederick Lamar and Jones Willie F
Current Estimated Value
Purchase Details
Closed on
May 26, 2011
Sold by
Williams Ashley Hollace and Stewart Ashley Hollace
Bought by
Jones Willie F and Jones Tonya F
Purchase Details
Closed on
May 23, 2011
Sold by
Durham Stanley L and Durham Dorethea J
Bought by
Williams Ashley Hollace
Purchase Details
Closed on
Oct 27, 2005
Sold by
Green Tree Servicing Llc
Bought by
Williams Ashley Hollace
Home Financials for this Owner
Home Financials are based on the most recent Mortgage that was taken out on this home.
Original Mortgage
$67,800
Interest Rate
5.76%
Mortgage Type
New Conventional
Purchase Details
Closed on
May 10, 2005
Sold by
Durham Stanley L and Durham Dorethea J
Bought by
Green Tree Servicing Llc
Create a Home Valuation Report for This Property
The Home Valuation Report is an in-depth analysis detailing your home's value as well as a comparison with similar homes in the area
Home Values in the Area
Average Home Value in this Area
Purchase History
| Date | Buyer | Sale Price | Title Company |
|---|---|---|---|
| Jones Frederick Lamar | -- | None Available | |
| Jones Willie F | $87,000 | -- | |
| Williams Ashley Hollace | $2,500 | -- | |
| Williams Ashley Hollace | $69,900 | -- | |
| Green Tree Servicing Llc | $2,500 | -- |
Source: Public Records
Mortgage History
| Date | Status | Borrower | Loan Amount |
|---|---|---|---|
| Previous Owner | Williams Ashley Hollace | $67,800 |
Source: Public Records
Tax History Compared to Growth
Tax History
| Year | Tax Paid | Tax Assessment Tax Assessment Total Assessment is a certain percentage of the fair market value that is determined by local assessors to be the total taxable value of land and additions on the property. | Land | Improvement |
|---|---|---|---|---|
| 2025 | $729 | $4,417 | $836 | $3,581 |
| 2024 | $729 | $4,417 | $836 | $3,581 |
| 2023 | $729 | $4,417 | $836 | $3,581 |
| 2022 | $564 | $3,841 | $709 | $3,132 |
| 2021 | $564 | $3,841 | $709 | $3,132 |
| 2020 | $511 | $3,841 | $709 | $3,132 |
| 2019 | $519 | $3,841 | $709 | $3,132 |
| 2018 | $519 | $3,841 | $709 | $3,132 |
| 2017 | $463 | $3,340 | $640 | $2,700 |
| 2016 | $464 | $3,340 | $640 | $2,700 |
| 2015 | $454 | $3,340 | $640 | $2,700 |
| 2014 | $450 | $3,340 | $640 | $2,700 |
Source: Public Records
Map
Nearby Homes
- 134 Layken Ln
- 190 Layken Ln
- 217 Castlebar St St
- 2991 S Carolina 417
- 737 Rockhurst Way
- 129 Owings Rd
- 232 Vista Pointe Dr
- 213 Castlebar St
- 221 Castlebar St
- 217 Castlebar St
- 210 Castlebar St
- 214 Castlebar St St
- 214 Castlebar St
- 17 Snowmill Rd Unit AG 5 Crane VE A
- 244 Cobridge Ln
- 244 Cobridge Ln Unit AG 27 Crane VE C
- 236 Cobridge Ln
- 236 Cobridge Ln Unit AG 25 Frost VE C
- 208 Cobridge Ln
- 208 Cobridge Ln Unit AG 18 Frost VE B
- 531 Bens Creek Rd
- 511 Bens Creek Rd
- 137 Circle Dr
- 607 Bens Creek Rd
- 435 Bens Creek Rd
- 435 Bens Creek Rd
- 146 Circle Dr
- 610 Bens Creek Rd
- 625 Bens Creek Rd
- 217 Circle Dr
- 2210 Sharon Rd
- 420 Bens Creek Rd
- 430 Bens Creek Rd
- 239 Circle Dr
- 216 Circle Dr
- 2150 Sharon Rd
- 0 Circle Dr
- 2120 Sharon Rd
- 240 Circle Dr
- Lot 113 Fenwick Dr