Estimated Value: $233,412 - $279,000
3
Beds
2
Baths
1,300
Sq Ft
$198/Sq Ft
Est. Value
About This Home
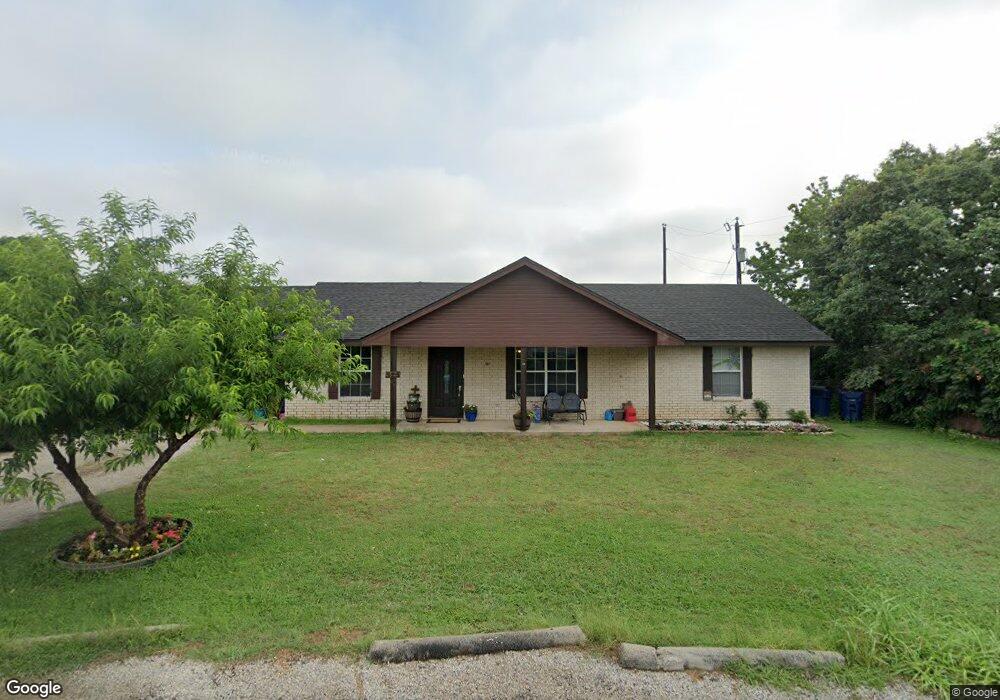
This home is located at 525 Brookfield Dr, Boyd, TX 76023 and is currently estimated at $257,603, approximately $198 per square foot. 525 Brookfield Dr is a home located in Wise County with nearby schools including Boyd Elementary School, Boyd Middle School, and Boyd High School.
Ownership History
Date
Name
Owned For
Owner Type
Purchase Details
Closed on
May 15, 2015
Sold by
Empire Mortgage X Inc
Bought by
Lara Justin M and Garcia Sergio Lara
Current Estimated Value
Home Financials for this Owner
Home Financials are based on the most recent Mortgage that was taken out on this home.
Original Mortgage
$108,252
Outstanding Balance
$83,605
Interest Rate
3.75%
Mortgage Type
FHA
Estimated Equity
$173,998
Purchase Details
Closed on
Sep 11, 2014
Sold by
Bowsher Lavonne
Bought by
Lara Justin M and Garcia Sergio Lara
Purchase Details
Closed on
Oct 6, 2003
Sold by
Vanover Cody D
Bought by
Lara Justin M and Garcia Sergio Lara
Purchase Details
Closed on
Apr 10, 2002
Sold by
Taylor Robin Scott and Taylor Brandi
Bought by
Lara Justin M and Garcia Sergio Lara
Purchase Details
Closed on
May 22, 2001
Sold by
Dickey Allen P
Bought by
Lara Justin M and Garcia Sergio Lara
Create a Home Valuation Report for This Property
The Home Valuation Report is an in-depth analysis detailing your home's value as well as a comparison with similar homes in the area
Home Values in the Area
Average Home Value in this Area
Purchase History
| Date | Buyer | Sale Price | Title Company |
|---|---|---|---|
| Lara Justin M | -- | None Available | |
| Lara Justin M | -- | -- | |
| Lara Justin M | -- | -- | |
| Lara Justin M | -- | -- | |
| Lara Justin M | -- | -- |
Source: Public Records
Mortgage History
| Date | Status | Borrower | Loan Amount |
|---|---|---|---|
| Open | Lara Justin M | $108,252 |
Source: Public Records
Tax History Compared to Growth
Tax History
| Year | Tax Paid | Tax Assessment Tax Assessment Total Assessment is a certain percentage of the fair market value that is determined by local assessors to be the total taxable value of land and additions on the property. | Land | Improvement |
|---|---|---|---|---|
| 2025 | $2,968 | $230,357 | -- | -- |
| 2024 | $2,968 | $209,415 | $0 | $0 |
| 2023 | $3,532 | $190,377 | $0 | $0 |
| 2022 | $3,714 | $173,070 | $0 | $0 |
| 2021 | $3,501 | $157,340 | $21,240 | $136,100 |
| 2020 | $3,236 | $148,720 | $21,240 | $127,480 |
| 2019 | $3,027 | $138,230 | $21,240 | $116,990 |
| 2018 | $2,789 | $119,750 | $10,620 | $109,130 |
| 2017 | $2,649 | $110,620 | $10,620 | $100,000 |
| 2016 | $2,508 | $104,700 | $10,620 | $94,080 |
| 2015 | -- | $104,220 | $10,620 | $93,600 |
| 2014 | -- | $98,370 | $10,620 | $87,750 |
Source: Public Records
Map
Nearby Homes
- 405 Edgewood Terrace
- 420 S Evans St
- 132 Ivy Terrace
- tbd S Oak St
- 111 Irish Ivy Ct
- AMBER Plan at Springhill South
- NATCHEZ Plan at Springhill South
- HANNA Plan at Springhill South
- TUPELO Plan at Springhill South
- SOUTHHAVEN Plan at Springhill South
- STARKVILLE Plan at Springhill South
- MACON Plan at Springhill South
- LEXINGTON Plan at Springhill South
- KENNEDY Plan at Springhill South
- DIANA Plan at Springhill South
- BROOKE Plan at Springhill South
- FLORENCE Plan at Springhill South
- MADISON Plan at Springhill South
- OXFORD Plan at Springhill South
- RENAE Plan at Springhill South
- 302 Arbor Ct
- 514 Brookfield Dr
- 517 Brookfield Dr
- 304 Arbor Ave
- 511 Brookfield Dr
- 312 Arbor Ave
- 300 Arbor Ct
- 505 Green Meadow Dr
- 509 Green Meadow Dr
- 501 Green Meadow Dr
- 504 Brookfield Dr
- 513 Green Meadow Dr
- 509 Brookfield Dr
- 428 Edgewood Terrace
- 517 Green Meadow Dr
- 500 Brookfield Dr
- 421 Edgewood Terrace
- 521 Green Meadow Dr
- 520 Village Creek Ct
- 429 Green Meadow Dr