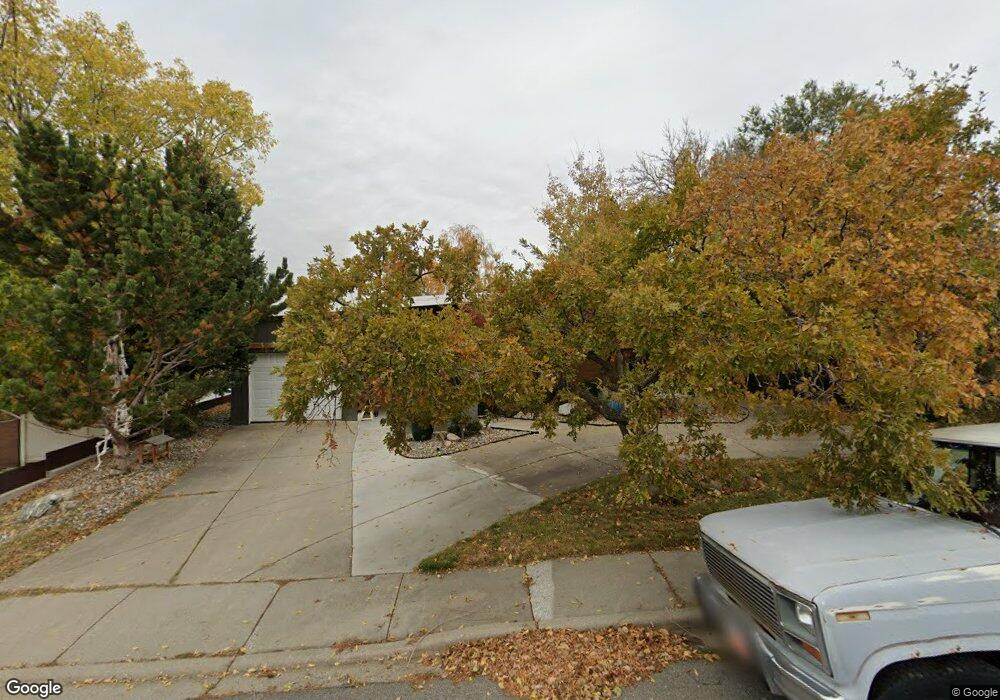
525 E 100 S Bountiful, UT 84010
Estimated Value: $518,000 - $543,000
4
Beds
2
Baths
2,584
Sq Ft
$204/Sq Ft
Est. Value
About This Home
This home is located at 525 E 100 S, Bountiful, UT 84010 and is currently estimated at $527,689, approximately $204 per square foot. 525 E 100 S is a home located in Davis County with nearby schools including Holbrook Elementary School, Millcreek Junior High School, and Bountiful High School.
Ownership History
Date
Name
Owned For
Owner Type
Purchase Details
Closed on
Mar 29, 1999
Sold by
Cirillo Teresa Kae
Bought by
Ovitt Jeffrey L and Ovitt Cheryl
Current Estimated Value
Home Financials for this Owner
Home Financials are based on the most recent Mortgage that was taken out on this home.
Original Mortgage
$150,550
Outstanding Balance
$36,561
Interest Rate
6.79%
Estimated Equity
$491,128
Create a Home Valuation Report for This Property
The Home Valuation Report is an in-depth analysis detailing your home's value as well as a comparison with similar homes in the area
Purchase History
| Date | Buyer | Sale Price | Title Company |
|---|---|---|---|
| Ovitt Jeffrey L | -- | Associated Title Company |
Source: Public Records
Mortgage History
| Date | Status | Borrower | Loan Amount |
|---|---|---|---|
| Open | Ovitt Jeffrey L | $150,550 |
Source: Public Records
Tax History
| Year | Tax Paid | Tax Assessment Tax Assessment Total Assessment is a certain percentage of the fair market value that is determined by local assessors to be the total taxable value of land and additions on the property. | Land | Improvement |
|---|---|---|---|---|
| 2025 | $2,810 | $255,750 | $118,517 | $137,233 |
| 2024 | $2,772 | $262,900 | $109,495 | $153,405 |
| 2023 | $2,647 | $455,000 | $195,631 | $259,369 |
| 2022 | $2,811 | $265,650 | $103,771 | $161,879 |
| 2021 | $2,371 | $341,000 | $153,989 | $187,011 |
| 2020 | $2,087 | $301,000 | $140,279 | $160,721 |
| 2019 | $2,128 | $300,000 | $144,713 | $155,287 |
| 2018 | $1,976 | $274,000 | $133,525 | $140,475 |
| 2016 | $1,708 | $128,260 | $40,039 | $88,221 |
| 2015 | $1,659 | $117,480 | $40,815 | $76,665 |
| 2014 | $1,713 | $125,252 | $40,815 | $84,437 |
| 2013 | -- | $117,415 | $50,459 | $66,956 |
Source: Public Records
Map
Nearby Homes
- 520 S Orchard Dr Unit 17
- 345 N 400 E
- 275 E Peach Ln S
- 103 S 100 E
- 337 Peach Ln
- 323 Peach Ln
- 545 S 100 E
- 49 E 200 N Unit 4
- 55 E 200 N Unit 2
- 41 E 200 N Unit 6
- 51 E 200 N Unit 3
- 254 N Main St
- 256 N Main St
- 252 N Main St
- 32 W 400 S
- 34 W 400 S
- 650 S Main St Unit 9106
- 551 N 1100 E
- 861 E Millbrook Way
- 1023 E 800 N
Your Personal Tour Guide
Ask me questions while you tour the home.