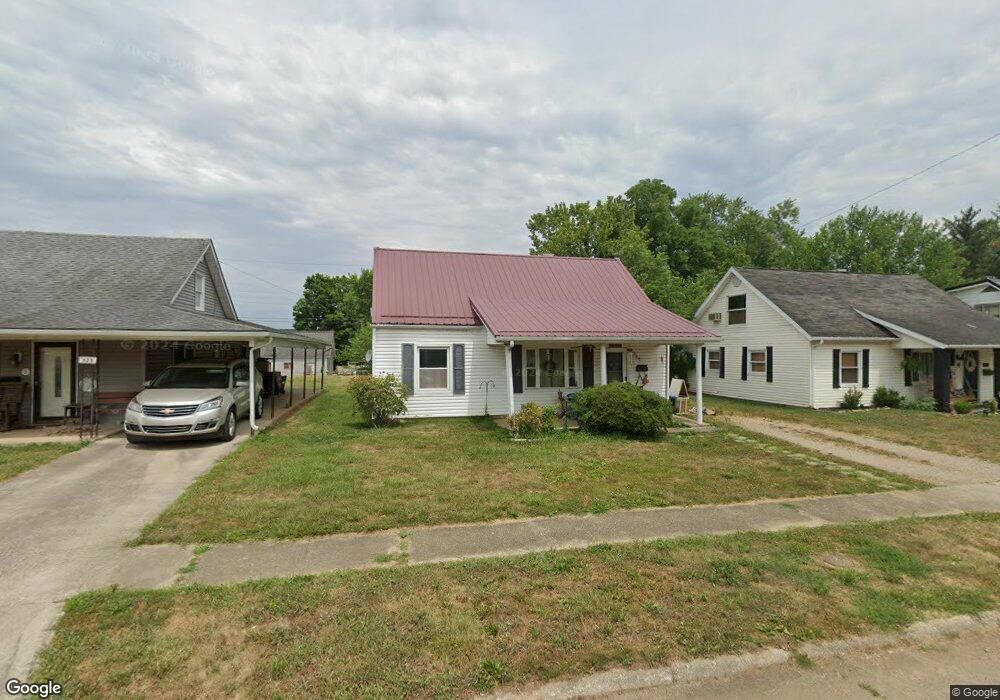
525 E 4th St Waverly, OH 45690
Estimated Value: $129,122 - $163,000
3
Beds
1
Bath
800
Sq Ft
$183/Sq Ft
Est. Value
About This Home
This home is located at 525 E 4th St, Waverly, OH 45690 and is currently estimated at $146,781, approximately $183 per square foot. 525 E 4th St is a home located in Pike County with nearby schools including Waverly Primary School, Waverly Intermediate School, and Waverly Junior High School.
Ownership History
Date
Name
Owned For
Owner Type
Purchase Details
Closed on
Oct 18, 2023
Sold by
Darling Cathy
Bought by
Riffe Sherry and Riffe William
Current Estimated Value
Purchase Details
Closed on
Jun 2, 2023
Sold by
Riffe Sherry
Bought by
Riffe William and Riffe Sherry
Purchase Details
Closed on
Oct 2, 2020
Sold by
Riffe Sherry
Bought by
Riffe Sherry and Darling Cathy
Purchase Details
Closed on
Jun 26, 2006
Sold by
Booth Mary F
Bought by
Booth Mary F and Riffe Sherry
Home Financials for this Owner
Home Financials are based on the most recent Mortgage that was taken out on this home.
Original Mortgage
$66,750
Interest Rate
6.73%
Mortgage Type
New Conventional
Create a Home Valuation Report for This Property
The Home Valuation Report is an in-depth analysis detailing your home's value as well as a comparison with similar homes in the area
Home Values in the Area
Average Home Value in this Area
Purchase History
| Date | Buyer | Sale Price | Title Company |
|---|---|---|---|
| Riffe Sherry | -- | None Listed On Document | |
| Riffe William | -- | None Listed On Document | |
| Riffe Sherry | -- | None Available | |
| Booth Mary F | -- | None Available |
Source: Public Records
Mortgage History
| Date | Status | Borrower | Loan Amount |
|---|---|---|---|
| Previous Owner | Booth Mary F | $66,750 |
Source: Public Records
Tax History
| Year | Tax Paid | Tax Assessment Tax Assessment Total Assessment is a certain percentage of the fair market value that is determined by local assessors to be the total taxable value of land and additions on the property. | Land | Improvement |
|---|---|---|---|---|
| 2025 | $956 | $25,970 | $6,930 | $19,040 |
| 2024 | $956 | $25,970 | $6,930 | $19,040 |
| 2023 | $919 | $25,970 | $6,930 | $19,040 |
| 2022 | $798 | $19,610 | $5,350 | $14,260 |
| 2021 | $783 | $19,610 | $5,350 | $14,260 |
| 2020 | $783 | $19,610 | $5,350 | $14,260 |
| 2019 | $670 | $16,630 | $4,540 | $12,090 |
| 2018 | $720 | $16,630 | $4,540 | $12,090 |
| 2017 | $758 | $18,930 | $4,540 | $14,390 |
| 2016 | $765 | $18,540 | $3,870 | $14,670 |
| 2015 | $765 | $18,540 | $3,870 | $14,670 |
| 2014 | $740 | $18,540 | $3,870 | $14,670 |
| 2013 | $750 | $18,540 | $3,870 | $14,670 |
| 2012 | $768 | $18,540 | $3,870 | $14,670 |
Source: Public Records
Map
Nearby Homes
Your Personal Tour Guide
Ask me questions while you tour the home.