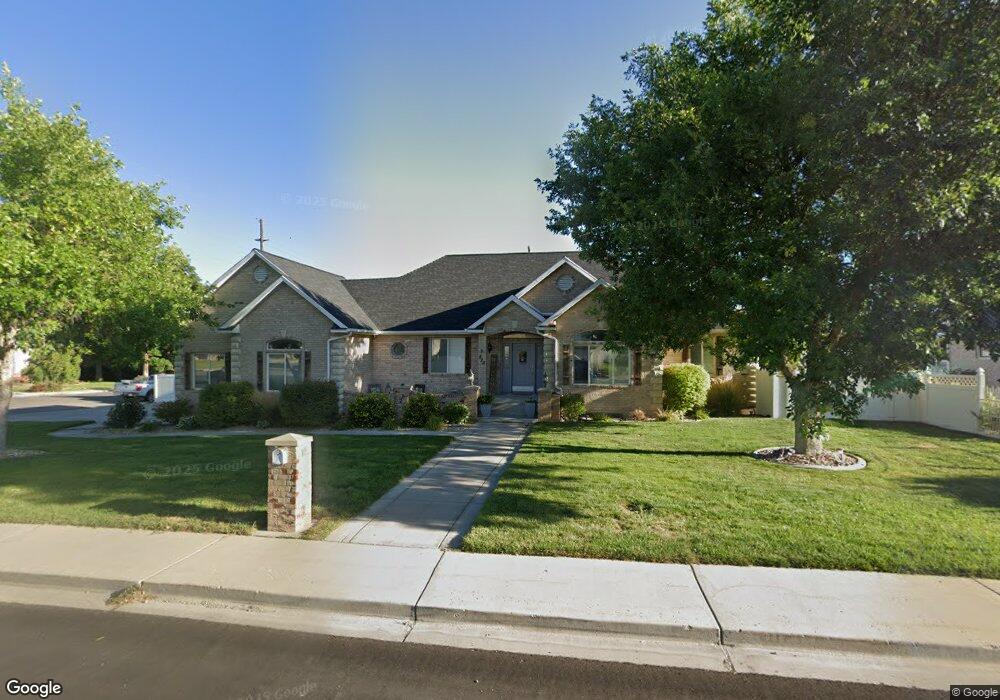
525 E 800 S Payson, UT 84651
Estimated Value: $646,839 - $671,000
4
Beds
3
Baths
4,228
Sq Ft
$156/Sq Ft
Est. Value
About This Home
This home is located at 525 E 800 S, Payson, UT 84651 and is currently estimated at $660,946, approximately $156 per square foot. 525 E 800 S is a home located in Utah County with nearby schools including Park View Elementary, Payson High School, and Payson Junior High School.
Ownership History
Date
Name
Owned For
Owner Type
Purchase Details
Closed on
Jan 6, 2014
Sold by
Hardle Steve
Bought by
Oldham Wade
Current Estimated Value
Purchase Details
Closed on
Aug 15, 2007
Sold by
Hardle Steve
Bought by
Hardle Steve
Home Financials for this Owner
Home Financials are based on the most recent Mortgage that was taken out on this home.
Original Mortgage
$288,000
Interest Rate
6.73%
Mortgage Type
New Conventional
Purchase Details
Closed on
Jun 29, 2005
Sold by
Lomento Jack and Lomento Pauline
Bought by
Hardle Steve
Home Financials for this Owner
Home Financials are based on the most recent Mortgage that was taken out on this home.
Original Mortgage
$200,000
Interest Rate
5.75%
Mortgage Type
Stand Alone First
Create a Home Valuation Report for This Property
The Home Valuation Report is an in-depth analysis detailing your home's value as well as a comparison with similar homes in the area
Home Values in the Area
Average Home Value in this Area
Purchase History
| Date | Buyer | Sale Price | Title Company |
|---|---|---|---|
| Oldham Wade | -- | North American Title | |
| Hardle Steve | -- | Juab Title & Abstract Compa | |
| Hardle Steve | -- | Empire Land Title Company |
Source: Public Records
Mortgage History
| Date | Status | Borrower | Loan Amount |
|---|---|---|---|
| Previous Owner | Hardle Steve | $288,000 | |
| Previous Owner | Hardle Steve | $200,000 |
Source: Public Records
Tax History
| Year | Tax Paid | Tax Assessment Tax Assessment Total Assessment is a certain percentage of the fair market value that is determined by local assessors to be the total taxable value of land and additions on the property. | Land | Improvement |
|---|---|---|---|---|
| 2025 | $3,203 | $339,570 | -- | -- |
| 2024 | $3,203 | $325,930 | $0 | $0 |
| 2023 | $3,247 | $331,375 | $0 | $0 |
| 2022 | $3,358 | $337,040 | $0 | $0 |
| 2021 | $2,844 | $457,900 | $104,700 | $353,200 |
| 2020 | $2,704 | $425,900 | $95,200 | $330,700 |
| 2019 | $2,451 | $395,800 | $90,700 | $305,100 |
| 2018 | $2,297 | $357,400 | $78,100 | $279,300 |
| 2017 | $2,070 | $173,250 | $0 | $0 |
| 2016 | $1,917 | $159,445 | $0 | $0 |
| 2015 | $1,787 | $147,565 | $0 | $0 |
| 2014 | -- | $135,025 | $0 | $0 |
Source: Public Records
Map
Nearby Homes
- 346 Jay Ln
- 420 E 600 S
- 252 E 670 S Unit 2
- 876 Greenridge Ave
- 229 E 670 S Unit 7
- 288 E 900 S
- 551 E 500 S
- 549 S Main St
- 88 W 700 S
- 1836 S 100 E
- 412 S Goosenest Dr
- 426 S Goosenest Dr
- 582 E 1250 S Unit 137
- 252 S 400 E
- 862 E 200 S
- 336 E 1330 S
- 900 S Goosenest Dr
- 753 N Emery Ln Unit 57
- 678 N Mountain View Dr
- 552 E Longview Dr Unit 29
Your Personal Tour Guide
Ask me questions while you tour the home.