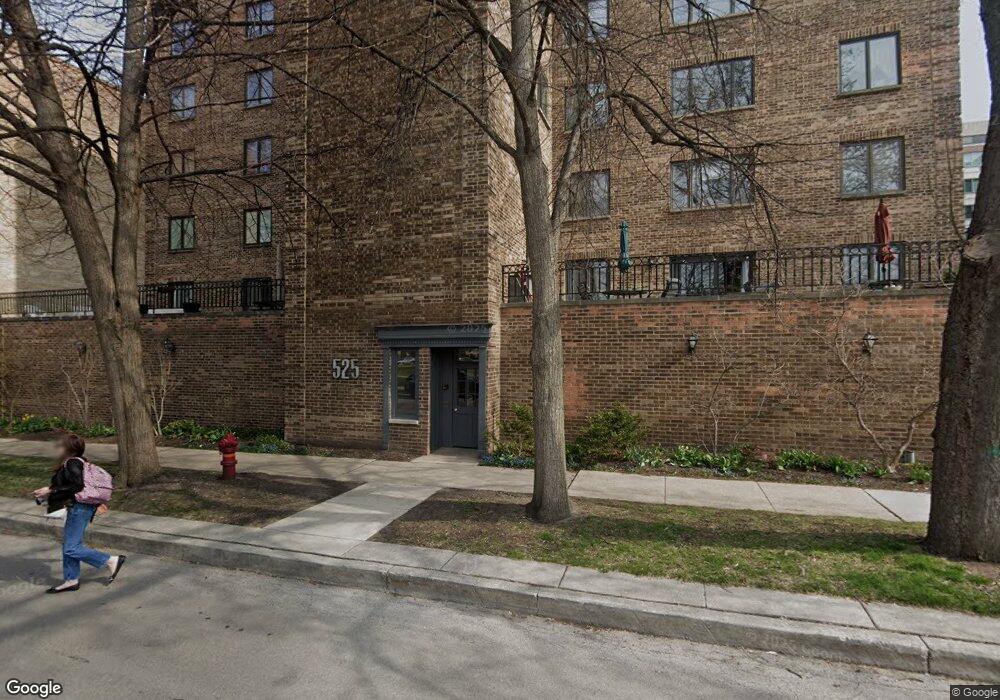
525 Grove St Unit 5B Evanston, IL 60201
Downtown Evanston NeighborhoodEstimated Value: $340,000 - $467,000
2
Beds
2
Baths
56,861
Sq Ft
$7/Sq Ft
Est. Value
About This Home
This home is located at 525 Grove St Unit 5B, Evanston, IL 60201 and is currently estimated at $388,421, approximately $6 per square foot. 525 Grove St Unit 5B is a home located in Cook County with nearby schools including Dewey Elementary School, Washington Elementary School, and Nichols Middle School.
Ownership History
Date
Name
Owned For
Owner Type
Purchase Details
Closed on
Nov 1, 2024
Sold by
Brodsky Nicole W
Bought by
Nicole W Brodsky Trust and Brodsky
Current Estimated Value
Purchase Details
Closed on
Jan 25, 2007
Sold by
Bl 525 Condo Llc
Bought by
Brodsky Nicole W
Purchase Details
Closed on
Feb 8, 2006
Sold by
Todd Elizabeth M and The Elizabeth M Todd 1999 Decl
Bought by
Bl 525 Condo Llc
Purchase Details
Closed on
Oct 15, 1999
Sold by
Caraher Susan Cronin and Mcmillan Susan
Bought by
Elizabeth M Todd 1999 Declaration Of Tr
Purchase Details
Closed on
Mar 29, 1994
Sold by
Petrich Mark A and Petrich Katherine
Bought by
Caraher Susan Cronin
Home Financials for this Owner
Home Financials are based on the most recent Mortgage that was taken out on this home.
Original Mortgage
$116,850
Interest Rate
7.17%
Create a Home Valuation Report for This Property
The Home Valuation Report is an in-depth analysis detailing your home's value as well as a comparison with similar homes in the area
Home Values in the Area
Average Home Value in this Area
Purchase History
| Date | Buyer | Sale Price | Title Company |
|---|---|---|---|
| Nicole W Brodsky Trust | -- | None Listed On Document | |
| Brodsky Nicole W | $322,500 | None Available | |
| Bl 525 Condo Llc | $265,000 | Cti | |
| Elizabeth M Todd 1999 Declaration Of Tr | $179,000 | -- | |
| Caraher Susan Cronin | $84,000 | -- |
Source: Public Records
Mortgage History
| Date | Status | Borrower | Loan Amount |
|---|---|---|---|
| Previous Owner | Caraher Susan Cronin | $116,850 |
Source: Public Records
Tax History Compared to Growth
Tax History
| Year | Tax Paid | Tax Assessment Tax Assessment Total Assessment is a certain percentage of the fair market value that is determined by local assessors to be the total taxable value of land and additions on the property. | Land | Improvement |
|---|---|---|---|---|
| 2024 | $5,610 | $26,491 | $1,030 | $25,461 |
| 2023 | $5,359 | $26,491 | $1,030 | $25,461 |
| 2022 | $5,359 | $26,491 | $1,030 | $25,461 |
| 2021 | $5,089 | $22,507 | $741 | $21,766 |
| 2020 | $5,081 | $22,507 | $741 | $21,766 |
| 2019 | $4,932 | $24,479 | $741 | $23,738 |
| 2018 | $4,137 | $18,537 | $618 | $17,919 |
| 2017 | $4,046 | $18,537 | $618 | $17,919 |
| 2016 | $4,059 | $18,537 | $618 | $17,919 |
| 2015 | $3,952 | $17,364 | $525 | $16,839 |
| 2014 | $3,929 | $17,364 | $525 | $16,839 |
| 2013 | $3,336 | $17,364 | $525 | $16,839 |
Source: Public Records
Map
Nearby Homes
- 525 Grove St Unit 4A
- 1500 Hinman Ave Unit 302
- 1508 Hinman Ave Unit 1A
- 1516 Hinman Ave Unit 211
- 1426 Chicago Ave Unit 1S
- 1408 Hinman Ave Unit 2
- 1580 Sherman Ave Unit 1005
- 522 Church St Unit 3D
- 1641 Hinman Ave Unit 3
- 807 Davis St Unit 1609
- 807 Davis St Unit 403
- 807 Davis St Unit 810
- 807 Davis St Unit 1308
- 1415 Sherman Ave Unit 207
- 1570 Elmwood Ave Unit 802
- 1509 Maple Ave Unit 3
- 909 Greenwood St Unit 1
- 807 Church St Unit 503
- 1236 Chicago Ave Unit B703
- 1210 Chicago Ave Unit C202
- 525 Grove St Unit 7D
- 525 Grove St Unit 3A
- 525 Grove St Unit 5D
- 525 Grove St Unit 6B
- 525 Grove St Unit 2A
- 525 Grove St Unit 5C
- 525 Grove St Unit 4C
- 525 Grove St Unit 4B
- 525 Grove St Unit 3B
- 525 Grove St Unit 3C
- 525 Grove St Unit 6C
- 525 Grove St Unit 7C
- 525 Grove St Unit 6A
- 525 Grove St Unit 3D
- 525 Grove St Unit 4A
- 525 Grove St Unit 7B
- 525 Grove St Unit 5A
- 525 Grove St Unit 6D
- 525 Grove St Unit 2D
- 525 Grove St Unit 2B