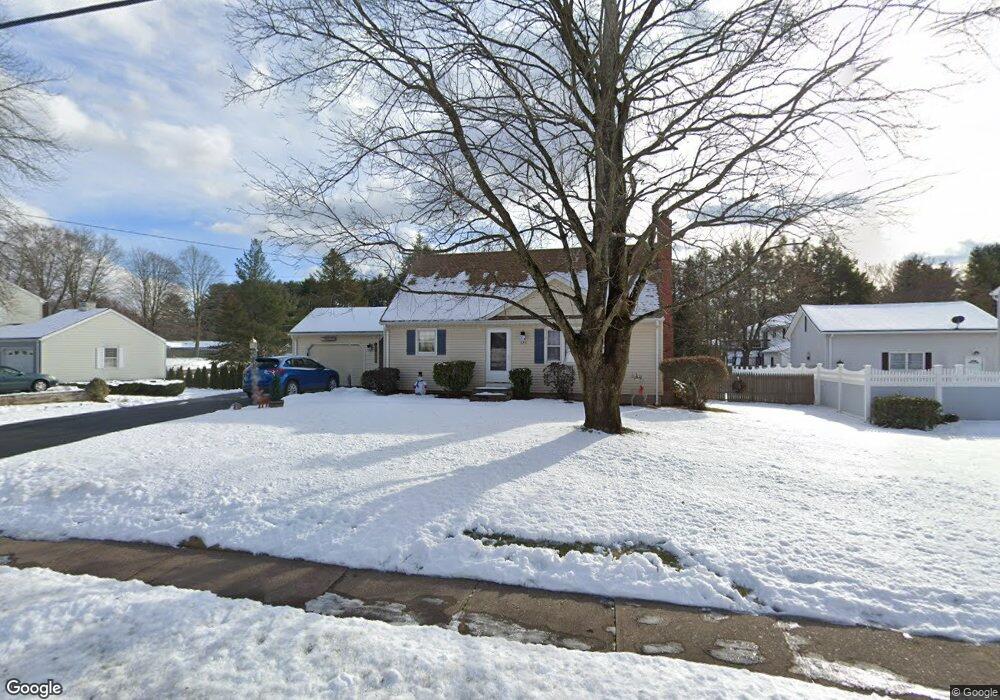
525 Hills St East Hartford, CT 06118
Estimated Value: $361,000 - $380,000
3
Beds
2
Baths
1,512
Sq Ft
$246/Sq Ft
Est. Value
About This Home
This home is located at 525 Hills St, East Hartford, CT 06118 and is currently estimated at $372,626, approximately $246 per square foot. 525 Hills St is a home located in Hartford County with nearby schools including Dr. Thomas S. O'Connell School, East Hartford Middle School, and East Hartford High School.
Ownership History
Date
Name
Owned For
Owner Type
Purchase Details
Closed on
Dec 10, 2001
Sold by
Reichardt George P and Dinosa Alice M
Bought by
Kisner David
Current Estimated Value
Home Financials for this Owner
Home Financials are based on the most recent Mortgage that was taken out on this home.
Original Mortgage
$146,205
Interest Rate
6.67%
Mortgage Type
Purchase Money Mortgage
Purchase Details
Closed on
Dec 16, 1998
Sold by
Arruda Marilyn D
Bought by
Lavigne Gary D
Create a Home Valuation Report for This Property
The Home Valuation Report is an in-depth analysis detailing your home's value as well as a comparison with similar homes in the area
Home Values in the Area
Average Home Value in this Area
Purchase History
| Date | Buyer | Sale Price | Title Company |
|---|---|---|---|
| Kisner David | $148,500 | -- | |
| Lavigne Gary D | $117,000 | -- |
Source: Public Records
Mortgage History
| Date | Status | Borrower | Loan Amount |
|---|---|---|---|
| Open | Lavigne Gary D | $234,871 | |
| Closed | Lavigne Gary D | $231,420 | |
| Closed | Lavigne Gary D | $66,000 | |
| Closed | Lavigne Gary D | $146,205 |
Source: Public Records
Tax History Compared to Growth
Tax History
| Year | Tax Paid | Tax Assessment Tax Assessment Total Assessment is a certain percentage of the fair market value that is determined by local assessors to be the total taxable value of land and additions on the property. | Land | Improvement |
|---|---|---|---|---|
| 2025 | $7,612 | $165,830 | $45,350 | $120,480 |
| 2024 | $7,297 | $165,830 | $45,350 | $120,480 |
| 2023 | $6,500 | $152,800 | $45,350 | $107,450 |
| 2022 | $6,265 | $152,800 | $45,350 | $107,450 |
| 2021 | $5,471 | $110,860 | $34,360 | $76,500 |
| 2020 | $5,534 | $110,860 | $34,360 | $76,500 |
| 2019 | $5,444 | $110,860 | $34,360 | $76,500 |
| 2018 | $5,284 | $110,860 | $34,360 | $76,500 |
| 2017 | $5,216 | $110,860 | $34,360 | $76,500 |
| 2016 | $5,351 | $116,690 | $34,360 | $82,330 |
| 2015 | $5,351 | $116,690 | $34,360 | $82,330 |
| 2014 | $5,298 | $116,690 | $34,360 | $82,330 |
Source: Public Records
Map
Nearby Homes