Estimated Value: $183,000 - $233,000
3
Beds
1
Bath
1,220
Sq Ft
$168/Sq Ft
Est. Value
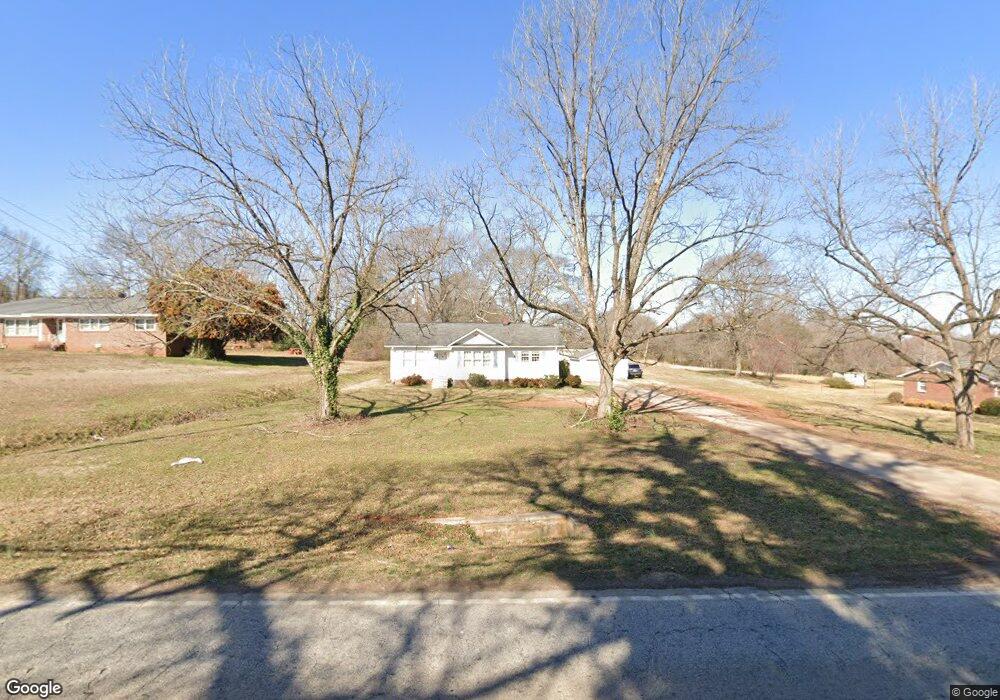
About This Home
This home is located at 525 Inman Rd, Lyman, SC 29365 and is currently estimated at $205,161, approximately $168 per square foot. 525 Inman Rd is a home located in Spartanburg County with nearby schools including Byrnes Freshman Academy, Beech Springs Intermediate School, and James F. Byrnes High School.
Ownership History
Date
Name
Owned For
Owner Type
Purchase Details
Closed on
Feb 14, 2022
Sold by
Cory Skelton Shaun
Bought by
Skelton Angelina Sophary Vann
Current Estimated Value
Home Financials for this Owner
Home Financials are based on the most recent Mortgage that was taken out on this home.
Original Mortgage
$88,570
Outstanding Balance
$82,244
Interest Rate
3.55%
Mortgage Type
New Conventional
Estimated Equity
$122,917
Purchase Details
Closed on
Nov 17, 2017
Sold by
Galloway Michael D and Galloway Steven R
Bought by
Skelton Shaun Cory and Skelton Angelina Sophary
Home Financials for this Owner
Home Financials are based on the most recent Mortgage that was taken out on this home.
Original Mortgage
$72,250
Interest Rate
3.95%
Mortgage Type
New Conventional
Create a Home Valuation Report for This Property
The Home Valuation Report is an in-depth analysis detailing your home's value as well as a comparison with similar homes in the area
Home Values in the Area
Average Home Value in this Area
Purchase History
| Date | Buyer | Sale Price | Title Company |
|---|---|---|---|
| Skelton Angelina Sophary Vann | -- | None Listed On Document | |
| Skelton Angelina Sophary Vann | -- | None Listed On Document | |
| Skelton Shaun Cory | $85,000 | None Available | |
| Galloway Sherry Kay | -- | None Available |
Source: Public Records
Mortgage History
| Date | Status | Borrower | Loan Amount |
|---|---|---|---|
| Open | Skelton Angelina Sophary Vann | $88,570 | |
| Closed | Skelton Angelina Sophary Vann | $88,570 | |
| Previous Owner | Skelton Shaun Cory | $72,250 |
Source: Public Records
Tax History
| Year | Tax Paid | Tax Assessment Tax Assessment Total Assessment is a certain percentage of the fair market value that is determined by local assessors to be the total taxable value of land and additions on the property. | Land | Improvement |
|---|---|---|---|---|
| 2022 | $634 | $3,704 | $1,008 | $2,696 |
| 2021 | $634 | $3,704 | $1,008 | $2,696 |
| 2020 | $619 | $3,704 | $1,008 | $2,696 |
| 2019 | $618 | $3,704 | $1,008 | $2,696 |
| 2018 | $592 | $3,704 | $1,008 | $2,696 |
| 2017 | $1,725 | $4,584 | $1,512 | $3,072 |
| 2016 | $1,702 | $4,584 | $1,512 | $3,072 |
| 2015 | $198 | $3,056 | $1,008 | $2,048 |
| 2014 | $195 | $3,056 | $1,008 | $2,048 |
Source: Public Records
Map
Nearby Homes
- 355 Laura Faye Ln
- 104 Mountainview Cir
- 1054 Westergard Way
- 1548 Purrington Ln
- 179 Beverly Ln
- 129 James Ave
- 947 Gibbons St
- 343 E Pyrenees Dr
- 684 Gilgal Ln
- 393 E Pyrenees Dr
- 317 Tracy Ct
- 313 Tracy Ct
- 938 Gibbons St
- 672 Gilgal Ln
- 934 Gibbons St
- 271 Walcott Dr
- 148 Peterson Dr
- 442 Birchbark Ln
- 347 E Pyrenees Dr
- 339 E Pyrenees Dr
Your Personal Tour Guide
Ask me questions while you tour the home.