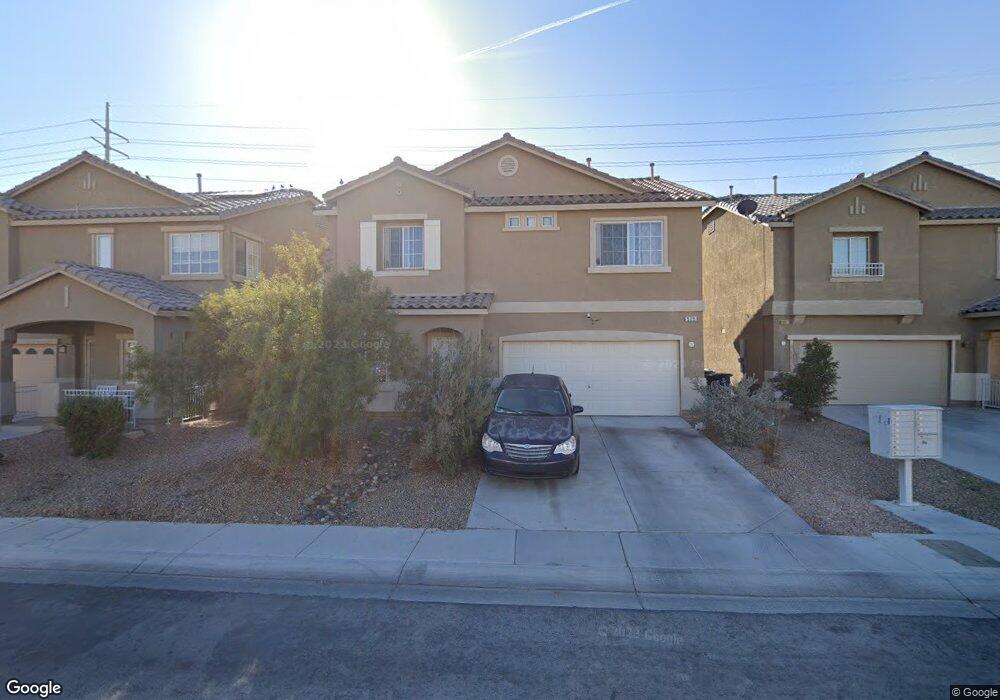
525 Iron Stirrup Ave Unit 1C North Las Vegas, NV 89081
Northridge NeighborhoodEstimated Value: $402,110 - $429,000
3
Beds
3
Baths
2,344
Sq Ft
$177/Sq Ft
Est. Value
About This Home
This home is located at 525 Iron Stirrup Ave Unit 1C, North Las Vegas, NV 89081 and is currently estimated at $414,528, approximately $176 per square foot. 525 Iron Stirrup Ave Unit 1C is a home located in Clark County with nearby schools including Don E. Hayden Elementary School, Ruby Duncan Elementary School, and Carroll M. Johnston STEM Academy of Environmental Studies.
Ownership History
Date
Name
Owned For
Owner Type
Purchase Details
Closed on
Apr 28, 2022
Sold by
Vo Linh-Chi T and Vo Tuan T
Bought by
B2tl Investment Inc
Current Estimated Value
Purchase Details
Closed on
Sep 4, 2012
Sold by
Orange Management Group Llc
Bought by
Vo Linh Chi and Huynh Tuan T
Home Financials for this Owner
Home Financials are based on the most recent Mortgage that was taken out on this home.
Original Mortgage
$86,250
Interest Rate
3.47%
Mortgage Type
New Conventional
Purchase Details
Closed on
Nov 8, 2011
Sold by
Gelenchi Fantahun and Gerba Genet
Bought by
Orange Management Group Llc
Purchase Details
Closed on
Nov 23, 2004
Sold by
Us Home Corp
Bought by
Gelenchi Fantahun and Gerba Genet
Home Financials for this Owner
Home Financials are based on the most recent Mortgage that was taken out on this home.
Original Mortgage
$244,700
Interest Rate
6.87%
Mortgage Type
Unknown
Create a Home Valuation Report for This Property
The Home Valuation Report is an in-depth analysis detailing your home's value as well as a comparison with similar homes in the area
Home Values in the Area
Average Home Value in this Area
Purchase History
| Date | Buyer | Sale Price | Title Company |
|---|---|---|---|
| B2tl Investment Inc | $265,049 | Lawyers Title | |
| Vo Linh Chi | $115,000 | Lawyers Title Of Nevada Cha | |
| Orange Management Group Llc | $97,100 | Accommodation | |
| Gelenchi Fantahun | $305,875 | North American Title Co |
Source: Public Records
Mortgage History
| Date | Status | Borrower | Loan Amount |
|---|---|---|---|
| Previous Owner | Vo Linh Chi | $86,250 | |
| Previous Owner | Gelenchi Fantahun | $244,700 | |
| Closed | Gelenchi Fantahun | $30,550 |
Source: Public Records
Tax History Compared to Growth
Tax History
| Year | Tax Paid | Tax Assessment Tax Assessment Total Assessment is a certain percentage of the fair market value that is determined by local assessors to be the total taxable value of land and additions on the property. | Land | Improvement |
|---|---|---|---|---|
| 2025 | $2,119 | $119,751 | $32,550 | $87,201 |
| 2024 | $1,962 | $119,751 | $32,550 | $87,201 |
| 2023 | $1,962 | $113,281 | $31,150 | $82,131 |
| 2022 | $1,817 | $99,832 | $24,850 | $74,982 |
| 2021 | $1,683 | $92,767 | $21,700 | $71,067 |
| 2020 | $1,560 | $91,435 | $21,000 | $70,435 |
| 2019 | $1,462 | $87,535 | $18,200 | $69,335 |
| 2018 | $1,395 | $71,664 | $12,950 | $58,714 |
| 2017 | $2,032 | $60,583 | $11,900 | $48,683 |
| 2016 | $1,306 | $55,558 | $9,800 | $45,758 |
| 2015 | $1,303 | $48,167 | $7,700 | $40,467 |
| 2014 | $1,262 | $36,516 | $5,250 | $31,266 |
Source: Public Records
Map
Nearby Homes
- 5908 Big Horn View St
- 5929 Caddy Ridge St
- 5824 Gemstone Peak St
- 305 Snow Dome Ave
- 5835 Running Horse Dr
- 6032 Draft Horse Dr
- 6009 Arbor Crest St
- 5929 Pink Chaff St
- 709 Brown Breeches Ave
- 808 Brown Breeches Ave
- 329 Gemstone Hill Ave
- 209 Copper Pine Ave
- 909 Nevada Blaze Ave
- 320 Gemstone Hill Ave
- 104 Big Cliff Ave
- 12 Copper Pine Ave
- 6084 Silken Saddle St
- 6020 Old Vines St
- 619 Harmony Rock Ave
- 6030 Hidden Summit St
- 525 Iron Stirrup Ave
- 525 Iron Stirrup Ave
- 605 Iron Stirrup Ave
- 521 Iron Stirrup Ave
- 609 Iron Stirrup Ave
- 517 Iron Stirrup Ave
- 613 Iron Stirrup Ave
- 6012 N Leaping Foal St
- 6012 Leaping Foal St
- 6013 Gum Springs St
- 513 Iron Stirrup Ave
- 617 Iron Stirrup Ave
- 6016 Leaping Foal St Unit 6016
- 6016 Leaping Foal St Unit n/a
- 6017 Gum Springs St
- 6005 Leaping Foal St
- 621 Iron Stirrup Ave
- 524 Riding Crop Ave
- 528 Riding Crop Ave