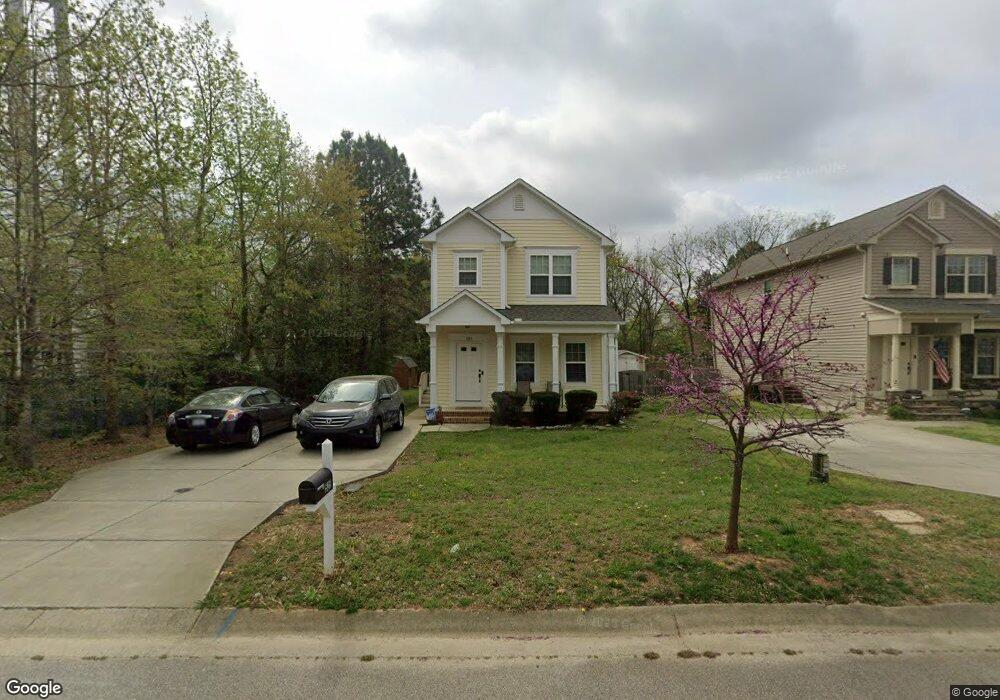
525 Lee St Unit 33 Holly Springs, NC 27540
Estimated Value: $413,000 - $446,000
--
Bed
1
Bath
1,832
Sq Ft
$235/Sq Ft
Est. Value
About This Home
This home is located at 525 Lee St Unit 33, Holly Springs, NC 27540 and is currently estimated at $430,418, approximately $234 per square foot. 525 Lee St Unit 33 is a home located in Wake County with nearby schools including Holly Springs Elementary School, Holly Ridge Middle School, and Holly Springs High School.
Ownership History
Date
Name
Owned For
Owner Type
Purchase Details
Closed on
Jul 20, 2018
Sold by
Filex Charles E and Filex Jennifer B
Bought by
Belcastro Jesse and Simon Elizabeth
Current Estimated Value
Home Financials for this Owner
Home Financials are based on the most recent Mortgage that was taken out on this home.
Original Mortgage
$200,800
Outstanding Balance
$174,023
Interest Rate
4.5%
Mortgage Type
New Conventional
Estimated Equity
$256,395
Purchase Details
Closed on
Jul 21, 2014
Sold by
Aspire Homes Llc
Bought by
Granholm Group Llc
Home Financials for this Owner
Home Financials are based on the most recent Mortgage that was taken out on this home.
Original Mortgage
$600,000
Interest Rate
4.2%
Mortgage Type
Purchase Money Mortgage
Create a Home Valuation Report for This Property
The Home Valuation Report is an in-depth analysis detailing your home's value as well as a comparison with similar homes in the area
Home Values in the Area
Average Home Value in this Area
Purchase History
| Date | Buyer | Sale Price | Title Company |
|---|---|---|---|
| Belcastro Jesse | $255,000 | None Available | |
| Granholm Group Llc | $123,000 | None Available |
Source: Public Records
Mortgage History
| Date | Status | Borrower | Loan Amount |
|---|---|---|---|
| Open | Belcastro Jesse | $200,800 | |
| Previous Owner | Granholm Group Llc | $600,000 |
Source: Public Records
Tax History Compared to Growth
Tax History
| Year | Tax Paid | Tax Assessment Tax Assessment Total Assessment is a certain percentage of the fair market value that is determined by local assessors to be the total taxable value of land and additions on the property. | Land | Improvement |
|---|---|---|---|---|
| 2025 | $3,468 | $400,603 | $125,000 | $275,603 |
| 2024 | $3,453 | $400,603 | $125,000 | $275,603 |
| 2023 | $2,780 | $255,931 | $47,000 | $208,931 |
| 2022 | $2,685 | $255,931 | $47,000 | $208,931 |
| 2021 | $2,635 | $255,931 | $47,000 | $208,931 |
| 2020 | $2,635 | $255,931 | $47,000 | $208,931 |
| 2019 | $2,484 | $204,825 | $41,000 | $163,825 |
| 2018 | $0 | $204,825 | $41,000 | $163,825 |
| 2017 | $2,166 | $204,825 | $41,000 | $163,825 |
| 2016 | $2,136 | $204,825 | $41,000 | $163,825 |
| 2015 | $1,935 | $36,000 | $36,000 | $0 |
| 2014 | $365 | $0 | $0 | $0 |
Source: Public Records
Map
Nearby Homes
- 421 Grigsby Ave
- 401 Vista Springs Cir
- 220 Avent Ferry Rd
- 105 E Maple Ave
- 308 E Maple Ave
- 717 Utley St
- 144 Holly Mountain Rd
- 104 Chilmark Ridge Dr
- 4014 Kentworth Dr
- 109 Lacombe Ct
- 137 Lacombe Ct
- 105 Cross Hill Ln
- 112 Burt St
- 705 Morton Farm Rd
- 321 Cross Hill Ln
- 413 Rhamkatte Rd
- 217 Jones Hill Rd
- 124 Cliffdale Rd
- 208 Old Ride Dr
- 321 Blalock St