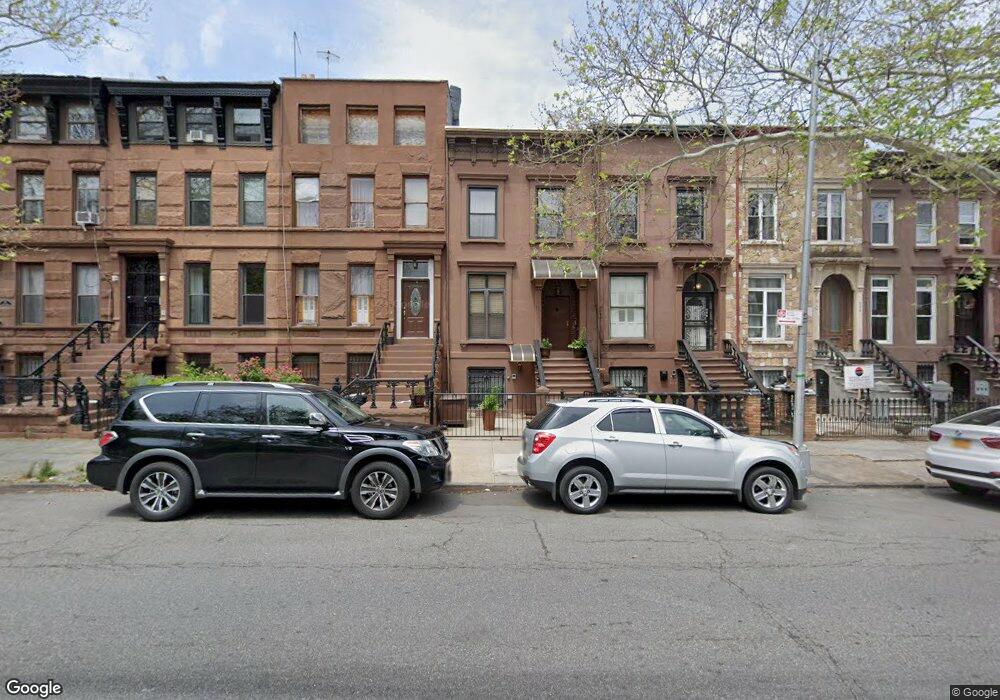
525 Macon St Unit Building Brooklyn, NY 11233
Bed-Stuy NeighborhoodEstimated Value: $1,573,000 - $2,074,119
--
Bed
3
Baths
2,100
Sq Ft
$852/Sq Ft
Est. Value
About This Home
This home is located at 525 Macon St Unit Building, Brooklyn, NY 11233 and is currently estimated at $1,788,530, approximately $851 per square foot. 525 Macon St Unit Building is a home located in Kings County with nearby schools including P.S. 262 El Hajj Malik El Shabazz Elementary School, La Cima Charter School, and Uncommon Excellence Boys Elementary School and Middle School.
Ownership History
Date
Name
Owned For
Owner Type
Purchase Details
Closed on
Oct 14, 2022
Sold by
Clemmons Deborah and Clemmons Murry C
Bought by
Court Casey and Dickerson Kiambu
Current Estimated Value
Home Financials for this Owner
Home Financials are based on the most recent Mortgage that was taken out on this home.
Original Mortgage
$600,000
Outstanding Balance
$580,685
Interest Rate
6.92%
Mortgage Type
Purchase Money Mortgage
Estimated Equity
$1,207,845
Purchase Details
Closed on
Feb 11, 2000
Sold by
Johnson Dolores
Bought by
Clemmons Murry C and Clemmons Deborah
Home Financials for this Owner
Home Financials are based on the most recent Mortgage that was taken out on this home.
Original Mortgage
$90,000
Interest Rate
5%
Mortgage Type
Seller Take Back
Create a Home Valuation Report for This Property
The Home Valuation Report is an in-depth analysis detailing your home's value as well as a comparison with similar homes in the area
Home Values in the Area
Average Home Value in this Area
Purchase History
| Date | Buyer | Sale Price | Title Company |
|---|---|---|---|
| Court Casey | $1,250,000 | -- | |
| Clemmons Murry C | $100,000 | -- |
Source: Public Records
Mortgage History
| Date | Status | Borrower | Loan Amount |
|---|---|---|---|
| Open | Court Casey | $600,000 | |
| Previous Owner | Clemmons Murry C | $90,000 |
Source: Public Records
Tax History Compared to Growth
Tax History
| Year | Tax Paid | Tax Assessment Tax Assessment Total Assessment is a certain percentage of the fair market value that is determined by local assessors to be the total taxable value of land and additions on the property. | Land | Improvement |
|---|---|---|---|---|
| 2025 | $4,058 | $104,880 | $17,640 | $87,240 |
| 2024 | $4,058 | $105,240 | $17,640 | $87,600 |
| 2023 | $4,104 | $125,940 | $17,640 | $108,300 |
| 2022 | $3,575 | $115,020 | $17,640 | $97,380 |
| 2021 | $3,677 | $94,320 | $17,640 | $76,680 |
| 2020 | $2,745 | $97,860 | $17,640 | $80,220 |
| 2019 | $3,230 | $97,140 | $17,640 | $79,500 |
| 2018 | $3,135 | $16,838 | $3,549 | $13,289 |
| 2017 | $2,987 | $16,123 | $3,613 | $12,510 |
| 2016 | $2,835 | $15,733 | $4,759 | $10,974 |
| 2015 | $1,615 | $14,853 | $6,746 | $8,107 |
| 2014 | $1,615 | $14,032 | $7,461 | $6,571 |
Source: Public Records
Map
Nearby Homes
- 505 Macon St
- 537 Halsey St
- 377 Macdonough St
- 383 Macdonough St
- 301 Stuyvesant Ave
- 596 Hancock St
- 350 Stuyvesant Ave
- 495 Halsey St
- 426 Macdonough St
- 560 Hancock St
- 524 Halsey St Unit TH1
- 524 Halsey St Unit 107
- 524 Halsey St Unit 105
- 654 Jefferson Ave Unit 3A
- 654 Jefferson Ave Unit 1B
- 654 Jefferson Ave Unit 2A
- 552 Macon St
- 319 Macdonough St
- 271 Decatur St
- 638 Halsey St
- 525 Macon St
- 523 Macon St
- 527A Macon St
- 527A Macon St Unit 2
- 521 Macon St
- 521 Macon St Unit 1
- 521 Macon St Unit 2
- 521 Macon St Unit 3
- 527 Macon St
- 527 Macon St Unit 1
- 527 Macon St Unit 2
- 529 Macon St
- 529 Macon St
- 529 Macon St Unit 2
- 519 Macon St Unit 5
- 519 Macon St Unit 2
- 519 Macon St Unit 1
- 519 Macon St Unit 3
- 519 Macon St
- 529A Macon St