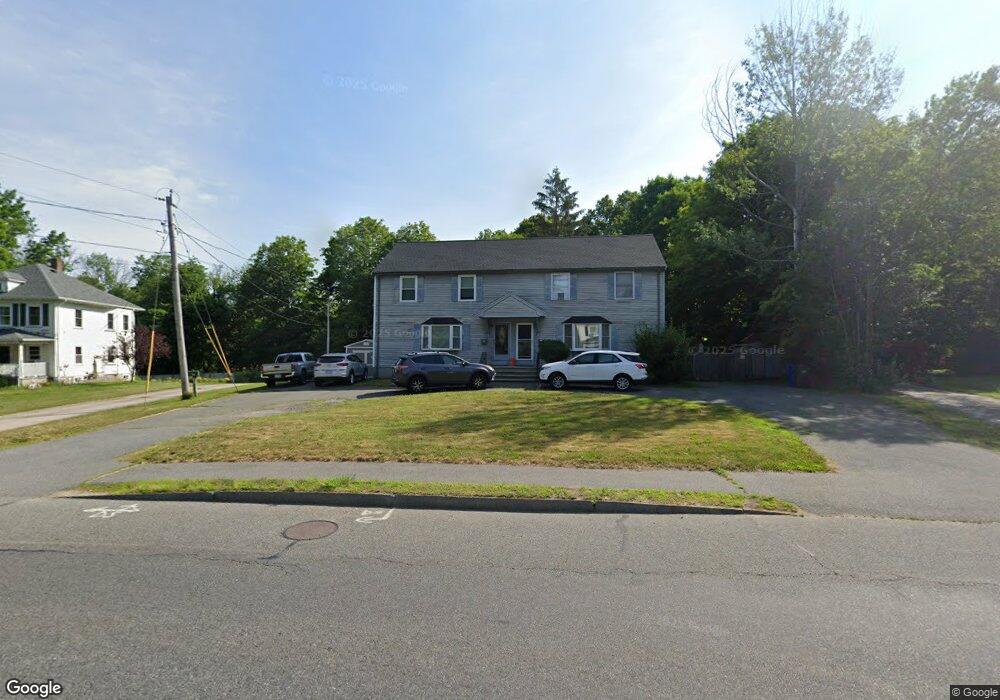
525 Main St Bridgewater, MA 02324
Estimated Value: $430,000 - $458,000
3
Beds
2
Baths
1,400
Sq Ft
$318/Sq Ft
Est. Value
About This Home
This home is located at 525 Main St, Bridgewater, MA 02324 and is currently estimated at $445,210, approximately $318 per square foot. 525 Main St is a home located in Plymouth County with nearby schools including Mitchell Elementary School, Williams Intermediate School, and Bridgewater Middle School.
Ownership History
Date
Name
Owned For
Owner Type
Purchase Details
Closed on
May 9, 2005
Sold by
Landry Keith E and Murphy Morghan
Bought by
Murphy Morghan
Current Estimated Value
Home Financials for this Owner
Home Financials are based on the most recent Mortgage that was taken out on this home.
Original Mortgage
$238,500
Outstanding Balance
$125,711
Interest Rate
6.01%
Mortgage Type
Purchase Money Mortgage
Estimated Equity
$319,499
Purchase Details
Closed on
Jan 30, 2001
Sold by
Borghi Cynthia Jean
Bought by
Landry Keith E and Murphy Morghan
Purchase Details
Closed on
Jan 9, 1991
Sold by
Main St T
Bought by
Borghi Cynthia J
Create a Home Valuation Report for This Property
The Home Valuation Report is an in-depth analysis detailing your home's value as well as a comparison with similar homes in the area
Home Values in the Area
Average Home Value in this Area
Purchase History
| Date | Buyer | Sale Price | Title Company |
|---|---|---|---|
| Murphy Morghan | -- | -- | |
| Landry Keith E | $162,225 | -- | |
| Borghi Cynthia J | $113,900 | -- |
Source: Public Records
Mortgage History
| Date | Status | Borrower | Loan Amount |
|---|---|---|---|
| Open | Borghi Cynthia J | $238,500 | |
| Previous Owner | Borghi Cynthia J | $225,600 | |
| Previous Owner | Borghi Cynthia J | $140,000 |
Source: Public Records
Tax History Compared to Growth
Tax History
| Year | Tax Paid | Tax Assessment Tax Assessment Total Assessment is a certain percentage of the fair market value that is determined by local assessors to be the total taxable value of land and additions on the property. | Land | Improvement |
|---|---|---|---|---|
| 2025 | $4,892 | $413,500 | $0 | $413,500 |
| 2024 | $4,488 | $369,700 | $0 | $369,700 |
| 2023 | $4,244 | $330,500 | $0 | $330,500 |
| 2022 | $4,170 | $291,200 | $0 | $291,200 |
| 2021 | $4,056 | $280,100 | $0 | $280,100 |
| 2020 | $3,971 | $269,600 | $0 | $269,600 |
| 2019 | $3,817 | $257,400 | $0 | $257,400 |
| 2018 | $3,807 | $250,600 | $0 | $250,600 |
| 2017 | $3,558 | $227,900 | $0 | $227,900 |
| 2016 | $3,478 | $223,800 | $0 | $223,800 |
| 2015 | $3,784 | $233,000 | $0 | $233,000 |
| 2014 | $3,749 | $230,700 | $0 | $230,700 |
Source: Public Records
Map
Nearby Homes
- 4 Mullen Way
- 60 Miranda Way
- 116 Center St
- 10 Duck Farm Ln
- 18 Aldrich Rd
- 30 Keenan St
- 248 Center St Unit 7
- 180 Main St Unit A15
- 180 Main St Unit A5
- 603 East St
- 12 Perkins St
- 128 Broad St
- 192 S Main St
- 580 Broad St Unit 1
- 580 Broad St Unit 2
- 74 Mount Prospect St
- Lot 3 Fontana Way
- Lot 2 Fontana Way
- 10 College Rd
- 167 Spring St