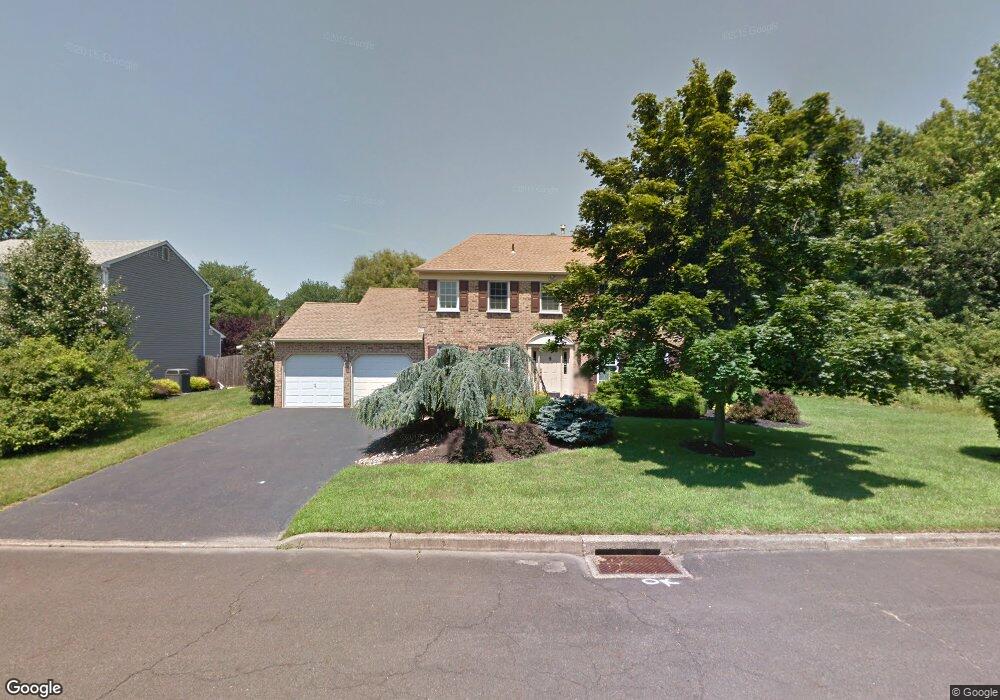
525 Maple Point Dr Langhorne, PA 19047
Estimated Value: $716,000 - $796,000
4
Beds
3
Baths
2,670
Sq Ft
$286/Sq Ft
Est. Value
About This Home
This home is located at 525 Maple Point Dr, Langhorne, PA 19047 and is currently estimated at $763,792, approximately $286 per square foot. 525 Maple Point Dr is a home located in Bucks County with nearby schools including Pearl S. Buck Elementary School, Maple Point Middle School, and Neshaminy High School.
Ownership History
Date
Name
Owned For
Owner Type
Purchase Details
Closed on
Jun 16, 2021
Sold by
Dorozala Ewa Ewelina
Bought by
Rindgen Clarence J and Rindgen Melinda S
Current Estimated Value
Home Financials for this Owner
Home Financials are based on the most recent Mortgage that was taken out on this home.
Original Mortgage
$225,000
Outstanding Balance
$187,442
Interest Rate
2.9%
Mortgage Type
New Conventional
Estimated Equity
$576,350
Purchase Details
Closed on
Sep 19, 2013
Sold by
Gutierrez Louis F
Bought by
Dorozala Ewa Ewelina
Home Financials for this Owner
Home Financials are based on the most recent Mortgage that was taken out on this home.
Original Mortgage
$320,000
Interest Rate
4.42%
Mortgage Type
New Conventional
Purchase Details
Closed on
Aug 4, 1989
Bought by
Gutierrez Louis F
Create a Home Valuation Report for This Property
The Home Valuation Report is an in-depth analysis detailing your home's value as well as a comparison with similar homes in the area
Home Values in the Area
Average Home Value in this Area
Purchase History
| Date | Buyer | Sale Price | Title Company |
|---|---|---|---|
| Rindgen Clarence J | $525,000 | Camelot Abstract | |
| Dorozala Ewa Ewelina | $400,000 | None Available | |
| Gutierrez Louis F | $247,500 | -- |
Source: Public Records
Mortgage History
| Date | Status | Borrower | Loan Amount |
|---|---|---|---|
| Open | Rindgen Clarence J | $225,000 | |
| Previous Owner | Dorozala Ewa Ewelina | $320,000 |
Source: Public Records
Tax History
| Year | Tax Paid | Tax Assessment Tax Assessment Total Assessment is a certain percentage of the fair market value that is determined by local assessors to be the total taxable value of land and additions on the property. | Land | Improvement |
|---|---|---|---|---|
| 2025 | $9,666 | $44,400 | $6,880 | $37,520 |
| 2024 | $9,666 | $44,400 | $6,880 | $37,520 |
| 2023 | $9,513 | $44,400 | $6,880 | $37,520 |
| 2022 | $9,263 | $44,400 | $6,880 | $37,520 |
| 2021 | $9,263 | $44,400 | $6,880 | $37,520 |
| 2020 | $9,152 | $44,400 | $6,880 | $37,520 |
| 2019 | $8,947 | $44,400 | $6,880 | $37,520 |
| 2018 | $8,783 | $44,400 | $6,880 | $37,520 |
| 2017 | $8,559 | $44,400 | $6,880 | $37,520 |
| 2016 | $8,559 | $44,400 | $6,880 | $37,520 |
| 2015 | $8,748 | $44,400 | $6,880 | $37,520 |
| 2014 | $8,748 | $44,400 | $6,880 | $37,520 |
Source: Public Records
Map
Nearby Homes
- 443 Knollbrook Dr
- 1003 Waterford Rd Unit 158
- 3406 Sterling Rd Unit 123
- 1903 Waterford Rd Unit 34
- 232 Polk Way
- 20 Griffin Way
- 7907 Spruce Mill Dr Unit 655
- 7705 Spruce Mill Dr Unit 669
- 24114 Hickory Ln
- 195 Roosevelt Dr
- 164 Tyler Way
- 81 Lavender Dr
- 1613 Lakeview Cir
- 486 Cedar Hollow Dr Unit 46
- 212 Clover Hill Ct
- 626A Palmer Ln Unit A
- 212 Shady Brook Dr Unit 283
- 350 Shady Brook Dr Unit 183
- 627 Bellflower Rd Unit V260
- 284 Greenview Rd
- 515 Maple Point Dr
- 620 Atkinson Ln
- 505 Maple Point Dr
- 630 Atkinson Ln
- 610 Atkinson Ln
- 632 Croasdale Dr
- 640 Atkinson Ln
- 495 Maple Point Dr
- 600 Atkinson Ln
- 633 Croasdale Dr
- 650 Atkinson Ln
- 622 Croasdale Dr
- 590 Atkinson Ln
- 570 Atkinson Ln
- 660 Atkinson Ln
- 631 Atkinson Ln
- 623 Croasdale Dr
- 621 Atkinson Ln
- 641 Atkinson Ln
- 651 Atkinson Ln