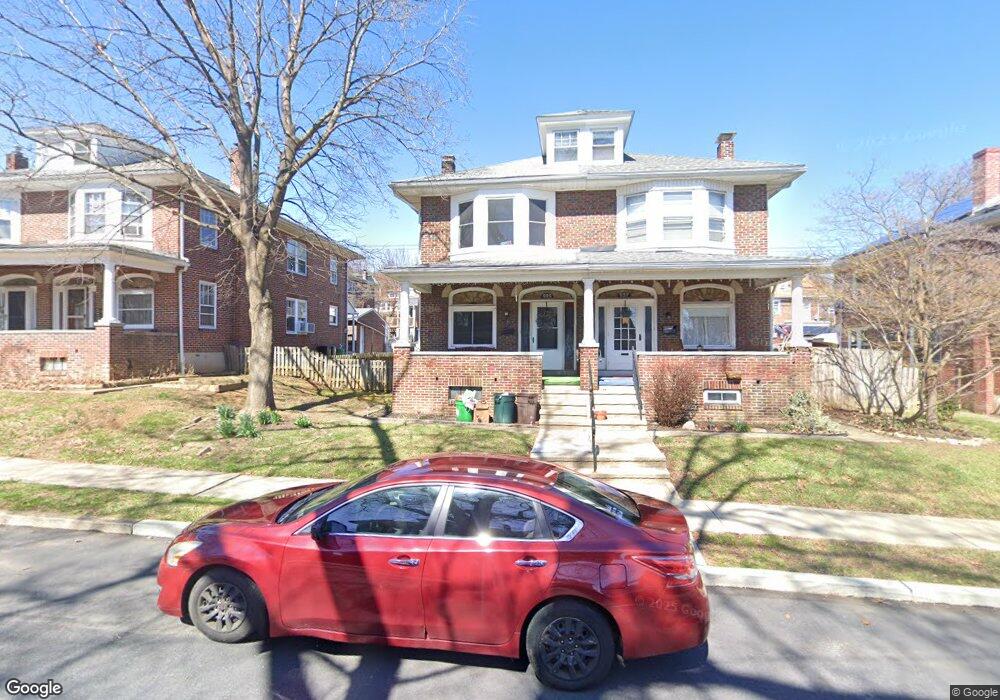
525 March St Reading, PA 19607
Estimated Value: $238,000 - $278,000
3
Beds
2
Baths
1,485
Sq Ft
$174/Sq Ft
Est. Value
About This Home
This home is located at 525 March St, Reading, PA 19607 and is currently estimated at $258,513, approximately $174 per square foot. 525 March St is a home located in Berks County with nearby schools including Cumru Elementary School, Governor Mifflin Intermediate School, and Governor Mifflin Middle School.
Ownership History
Date
Name
Owned For
Owner Type
Purchase Details
Closed on
Apr 30, 2014
Sold by
Batz Michelle Lee and Gentile Felix
Bought by
Gentile Michelle
Current Estimated Value
Home Financials for this Owner
Home Financials are based on the most recent Mortgage that was taken out on this home.
Original Mortgage
$109,975
Outstanding Balance
$33,933
Interest Rate
4.42%
Mortgage Type
New Conventional
Estimated Equity
$224,580
Purchase Details
Closed on
Apr 29, 2005
Sold by
Ernst Barry R
Bought by
Batz Michelle Lee
Home Financials for this Owner
Home Financials are based on the most recent Mortgage that was taken out on this home.
Original Mortgage
$120,000
Interest Rate
5.78%
Mortgage Type
Fannie Mae Freddie Mac
Purchase Details
Closed on
Dec 12, 2001
Sold by
Link Mark J and Link Susan Jean
Bought by
Ernst Barry R
Home Financials for this Owner
Home Financials are based on the most recent Mortgage that was taken out on this home.
Original Mortgage
$67,425
Interest Rate
6.61%
Create a Home Valuation Report for This Property
The Home Valuation Report is an in-depth analysis detailing your home's value as well as a comparison with similar homes in the area
Home Values in the Area
Average Home Value in this Area
Purchase History
| Date | Buyer | Sale Price | Title Company |
|---|---|---|---|
| Gentile Michelle | -- | Advantage Title Co | |
| Batz Michelle Lee | $120,000 | Fidelity Natl Title Ins Co | |
| Ernst Barry R | $89,900 | -- |
Source: Public Records
Mortgage History
| Date | Status | Borrower | Loan Amount |
|---|---|---|---|
| Open | Gentile Michelle | $109,975 | |
| Previous Owner | Batz Michelle Lee | $120,000 | |
| Previous Owner | Ernst Barry R | $67,425 |
Source: Public Records
Tax History Compared to Growth
Tax History
| Year | Tax Paid | Tax Assessment Tax Assessment Total Assessment is a certain percentage of the fair market value that is determined by local assessors to be the total taxable value of land and additions on the property. | Land | Improvement |
|---|---|---|---|---|
| 2025 | $1,316 | $81,500 | $20,700 | $60,800 |
| 2024 | $3,715 | $81,500 | $20,700 | $60,800 |
| 2023 | $3,618 | $81,500 | $20,700 | $60,800 |
| 2022 | $3,578 | $81,500 | $20,700 | $60,800 |
| 2021 | $3,537 | $81,500 | $20,700 | $60,800 |
| 2020 | $3,537 | $81,500 | $20,700 | $60,800 |
| 2019 | $3,496 | $81,500 | $20,700 | $60,800 |
| 2018 | $3,455 | $81,500 | $20,700 | $60,800 |
| 2017 | $3,391 | $81,500 | $20,700 | $60,800 |
| 2016 | $1,159 | $81,500 | $20,700 | $60,800 |
| 2015 | $1,159 | $81,500 | $20,700 | $60,800 |
| 2014 | $1,059 | $81,500 | $20,700 | $60,800 |
Source: Public Records
Map
Nearby Homes
- 617 Meade Tc
- 429 Devon Terrace
- 123 High Blvd
- 602 Harding Ave
- 15 Bare Ave
- 1501 Gregg Ave
- 1530 Liggett Ave
- 511 Grill Ave
- 524 Pershing Blvd
- 1432 Liggett Ave
- 1407 Lancaster Ave
- 1602 Crowder Ave
- 405 State St
- 136 E Elm St
- 137 E Elm St
- 1355 Liggett Ave
- 33 Pennsylvania Ave
- 27 Pennsylvania Ave
- 1 Vireo Dr
- 24 Philadelphia Ave