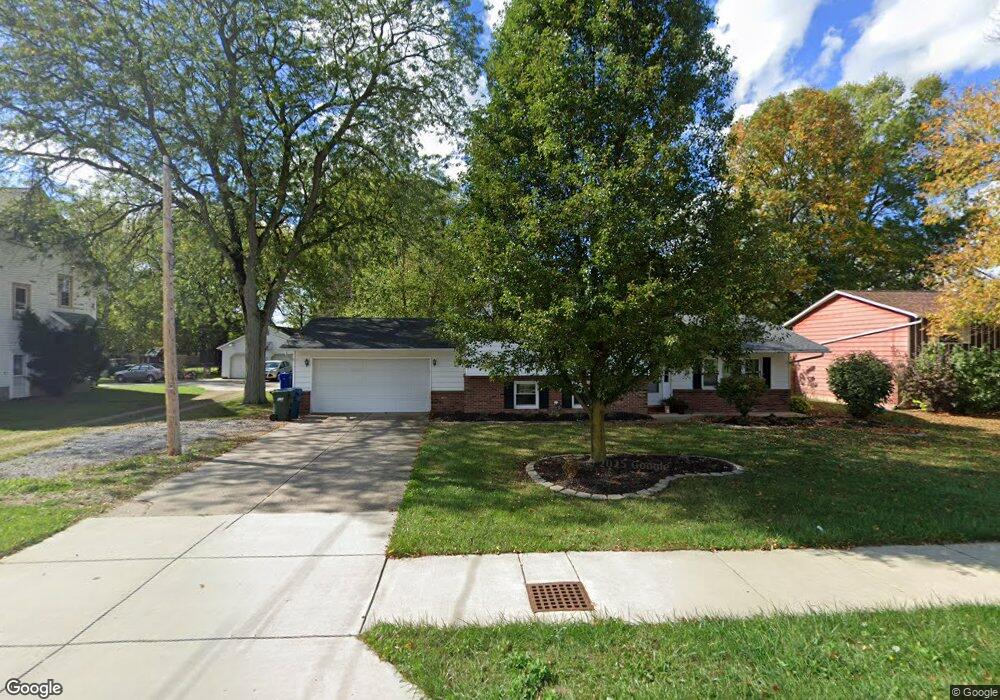
525 N Center St Lagrange, OH 44050
Estimated Value: $306,000 - $347,000
4
Beds
3
Baths
1,908
Sq Ft
$168/Sq Ft
Est. Value
About This Home
This home is located at 525 N Center St, Lagrange, OH 44050 and is currently estimated at $319,805, approximately $167 per square foot. 525 N Center St is a home located in Lorain County with nearby schools including Keystone Elementary School, Keystone Middle School, and Keystone High School.
Ownership History
Date
Name
Owned For
Owner Type
Purchase Details
Closed on
Jul 6, 2017
Sold by
Cabassa Dennis J and Cabassa Michelle
Bought by
Stevens Sarah J and Stevens David C
Current Estimated Value
Home Financials for this Owner
Home Financials are based on the most recent Mortgage that was taken out on this home.
Original Mortgage
$152,192
Outstanding Balance
$126,654
Interest Rate
3.95%
Mortgage Type
FHA
Estimated Equity
$193,151
Purchase Details
Closed on
Dec 29, 2003
Sold by
Acord Orville Duane and Acord Iris L
Bought by
Cabassa Dennis J and Cabassa Michelle
Home Financials for this Owner
Home Financials are based on the most recent Mortgage that was taken out on this home.
Original Mortgage
$117,530
Interest Rate
5.94%
Mortgage Type
VA
Create a Home Valuation Report for This Property
The Home Valuation Report is an in-depth analysis detailing your home's value as well as a comparison with similar homes in the area
Home Values in the Area
Average Home Value in this Area
Purchase History
| Date | Buyer | Sale Price | Title Company |
|---|---|---|---|
| Stevens Sarah J | $155,000 | Chicago Title | |
| Cabassa Dennis J | $115,025 | Elyria Land Title |
Source: Public Records
Mortgage History
| Date | Status | Borrower | Loan Amount |
|---|---|---|---|
| Open | Stevens Sarah J | $152,192 | |
| Previous Owner | Cabassa Dennis J | $117,530 |
Source: Public Records
Tax History Compared to Growth
Tax History
| Year | Tax Paid | Tax Assessment Tax Assessment Total Assessment is a certain percentage of the fair market value that is determined by local assessors to be the total taxable value of land and additions on the property. | Land | Improvement |
|---|---|---|---|---|
| 2024 | $3,955 | $93,317 | $12,401 | $80,917 |
| 2023 | $2,861 | $56,382 | $10,770 | $45,612 |
| 2022 | $2,842 | $56,382 | $10,770 | $45,612 |
| 2021 | $2,843 | $56,382 | $10,770 | $45,612 |
| 2020 | $2,777 | $49,070 | $9,370 | $39,700 |
| 2019 | $2,761 | $49,070 | $9,370 | $39,700 |
| 2018 | $2,665 | $49,070 | $9,370 | $39,700 |
| 2017 | $2,558 | $44,090 | $7,790 | $36,300 |
| 2016 | $2,541 | $44,090 | $7,790 | $36,300 |
| 2015 | $2,537 | $44,090 | $7,790 | $36,300 |
| 2014 | $2,239 | $44,090 | $7,790 | $36,300 |
| 2013 | $2,172 | $44,090 | $7,790 | $36,300 |
Source: Public Records
Map
Nearby Homes
- 128 Harvest Ct
- 433 N Center St
- 516 Appomattox Ct
- 171 Keywood Blvd
- 548 William St
- 607 Rundle St
- 756 N Center St
- 630 Rundle St
- 40725 Biggs Rd
- 829 Robinson Dr
- 822 Robinson Dr
- 831 Robinson Dr
- 194 Railroad St
- 808 Buckingham Dr
- 800 Buckingham Dr
- 0 Dill Ct Unit 5072837
- 110 Railroad St
- 41635 Parsons Rd
- 40175 Banks Rd
- 40185 Banks Rd
- 527 N Center St
- 521 N Center St
- 108 Loperwood Ln
- 517 N Center St
- 524 N Center St
- 112 Loperwood Ln
- 529 N Center St
- 520 N Center St
- 513 N Center St
- 107 Loperwood Ln
- 41737 Biggs Rd
- 533 N Center St
- 111 Loperwood Ln
- 518 N Center St
- 120 Loperwood Ln
- 535 N Center St
- 115 Loperwood Ln
- S/L 6 Keywood
- 0 Keywood Blvd
- 0 Keywood Blvd