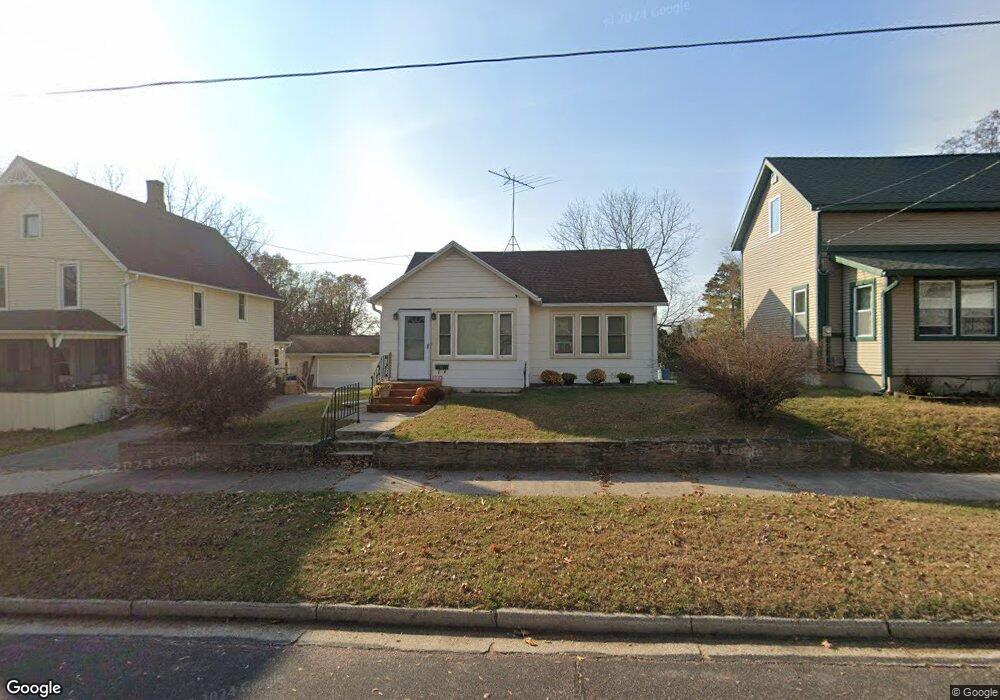
525 N Walnut St Reedsburg, WI 53959
Estimated Value: $153,000 - $228,000
2
Beds
1
Bath
652
Sq Ft
$293/Sq Ft
Est. Value
About This Home
This home is located at 525 N Walnut St, Reedsburg, WI 53959 and is currently estimated at $191,287, approximately $293 per square foot. 525 N Walnut St is a home located in Sauk County with nearby schools including Webb Middle School, Reedsburg Area High School, and St. Peter's Lutheran School.
Ownership History
Date
Name
Owned For
Owner Type
Purchase Details
Closed on
Jul 26, 2011
Sold by
Desimone Steven M and Desimone Michelle L
Bought by
Desimone Michelle
Current Estimated Value
Purchase Details
Closed on
Feb 18, 2011
Sold by
Desimone Steven M and Desimone Michael L
Bought by
Desimone Steven M and Desimone Michelle L
Purchase Details
Closed on
Jul 23, 2008
Sold by
Milton John F and Milton Tamara H
Bought by
Desimone Steven M and Adamozyk Michelle L
Home Financials for this Owner
Home Financials are based on the most recent Mortgage that was taken out on this home.
Original Mortgage
$86,000
Interest Rate
6.37%
Mortgage Type
Adjustable Rate Mortgage/ARM
Purchase Details
Closed on
Aug 28, 2005
Sold by
Mcdonough Alice B and Mcdonough Larry G
Bought by
Nelsen Tamra H
Home Financials for this Owner
Home Financials are based on the most recent Mortgage that was taken out on this home.
Original Mortgage
$89,900
Interest Rate
5.89%
Mortgage Type
New Conventional
Create a Home Valuation Report for This Property
The Home Valuation Report is an in-depth analysis detailing your home's value as well as a comparison with similar homes in the area
Home Values in the Area
Average Home Value in this Area
Purchase History
| Date | Buyer | Sale Price | Title Company |
|---|---|---|---|
| Desimone Michelle | -- | None Available | |
| Desimone Steven M | -- | None Available | |
| Desimone Steven M | $92,000 | None Available | |
| Nelsen Tamra H | -- | None Available |
Source: Public Records
Mortgage History
| Date | Status | Borrower | Loan Amount |
|---|---|---|---|
| Previous Owner | Desimone Steven M | $86,000 | |
| Previous Owner | Nelsen Tamra H | $89,900 |
Source: Public Records
Tax History Compared to Growth
Tax History
| Year | Tax Paid | Tax Assessment Tax Assessment Total Assessment is a certain percentage of the fair market value that is determined by local assessors to be the total taxable value of land and additions on the property. | Land | Improvement |
|---|---|---|---|---|
| 2024 | $2,244 | $143,700 | $25,400 | $118,300 |
| 2023 | $2,040 | $99,400 | $19,700 | $79,700 |
| 2022 | $2,057 | $99,400 | $19,700 | $79,700 |
| 2021 | $1,918 | $99,400 | $19,700 | $79,700 |
| 2020 | $2,045 | $99,400 | $19,700 | $79,700 |
| 2019 | $2,140 | $90,200 | $17,500 | $72,700 |
| 2018 | $2,118 | $90,200 | $17,500 | $72,700 |
| 2017 | $2,086 | $90,200 | $17,500 | $72,700 |
| 2016 | $2,079 | $90,200 | $17,500 | $72,700 |
| 2015 | $2,056 | $90,200 | $17,500 | $72,700 |
| 2014 | -- | $90,200 | $17,500 | $72,700 |
Source: Public Records
Map
Nearby Homes
- 609 N Walnut St
- 635 N Park St
- 295 8th St
- 324 N Pine St
- 120 N Locust St
- 4.03 Acres E Main St
- 532 Laurel St
- 246 Laurel St
- 523 Vine St
- S2786 County Road V
- 648 E Main St
- 700 E Main St
- 146 S Willow St
- 325 Warren Ave
- 608 Lavalle St
- S2740 County Road K
- 202 S Dewey Ave
- 206 S Dewey Ave
- 212 S Dewey Ave
- 216 S Dewey Ave
- 535 N Walnut St
- 509 N Walnut St
- 501 N Walnut St
- 510 N Walnut St
- 524 N Walnut St
- 534 N Walnut St
- 544 N Walnut St
- 449 N Walnut St
- 502 N Walnut St
- 545 N Walnut St
- 241 5th St
- 437 N Walnut St
- 448 N Walnut St
- 534 N Webb Ave
- 603 N Walnut St
- 251 5th St
- 521 N Park St
- 440 N Webb Ave
- 517 N Park St
- 436 N Walnut St