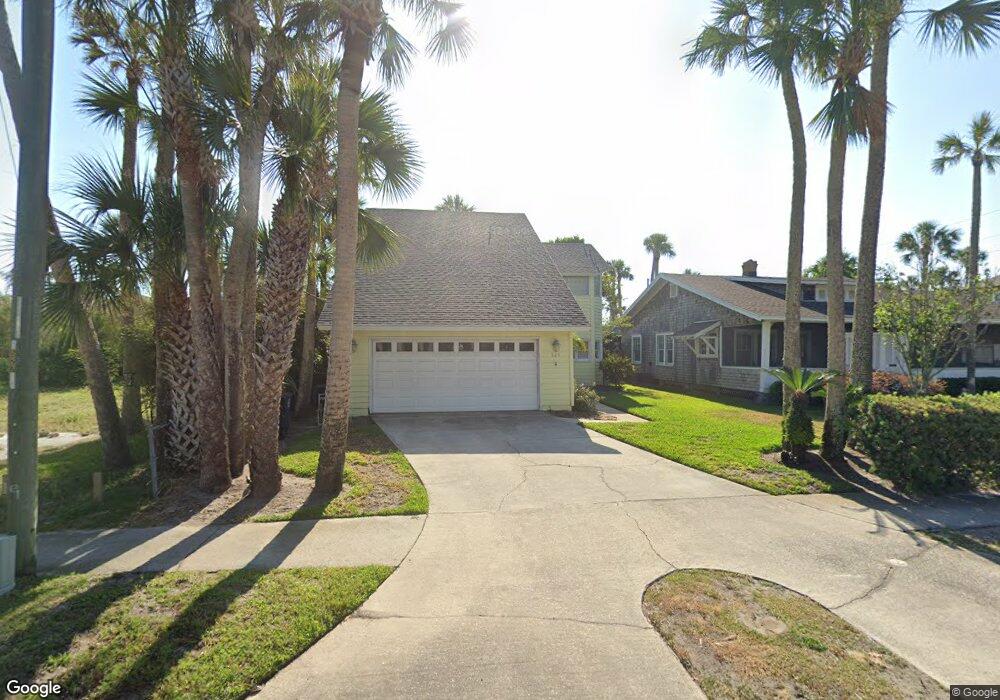
525 Ocean Blvd Atlantic Beach, FL 32233
Estimated Value: $1,298,663 - $1,585,000
3
Beds
3
Baths
2,065
Sq Ft
$711/Sq Ft
Est. Value
About This Home
This home is located at 525 Ocean Blvd, Atlantic Beach, FL 32233 and is currently estimated at $1,469,166, approximately $711 per square foot. 525 Ocean Blvd is a home located in Duval County with nearby schools including Atlantic Beach Elementary School, Mayport Middle School, and Duncan U. Fletcher High School.
Ownership History
Date
Name
Owned For
Owner Type
Purchase Details
Closed on
May 11, 2005
Sold by
Haas Christopher
Bought by
Haas Christopher and Haas Romney Cody
Current Estimated Value
Purchase Details
Closed on
Apr 30, 2001
Sold by
White Joseph A and White Charlotte D
Bought by
Haas Christopher
Home Financials for this Owner
Home Financials are based on the most recent Mortgage that was taken out on this home.
Original Mortgage
$300,000
Outstanding Balance
$111,937
Interest Rate
7.02%
Estimated Equity
$1,357,229
Create a Home Valuation Report for This Property
The Home Valuation Report is an in-depth analysis detailing your home's value as well as a comparison with similar homes in the area
Home Values in the Area
Average Home Value in this Area
Purchase History
| Date | Buyer | Sale Price | Title Company |
|---|---|---|---|
| Haas Christopher | -- | -- | |
| Haas Christopher | $375,000 | -- |
Source: Public Records
Mortgage History
| Date | Status | Borrower | Loan Amount |
|---|---|---|---|
| Open | Haas Christopher | $300,000 | |
| Closed | Haas Christopher | $56,250 |
Source: Public Records
Tax History Compared to Growth
Tax History
| Year | Tax Paid | Tax Assessment Tax Assessment Total Assessment is a certain percentage of the fair market value that is determined by local assessors to be the total taxable value of land and additions on the property. | Land | Improvement |
|---|---|---|---|---|
| 2025 | $14,906 | $859,639 | -- | -- |
| 2024 | $14,185 | $985,970 | $787,500 | $198,470 |
| 2023 | $14,185 | $982,261 | $765,000 | $217,261 |
| 2022 | $12,567 | $953,817 | $765,000 | $188,817 |
| 2021 | $10,239 | $587,146 | $427,500 | $159,646 |
| 2020 | $10,195 | $581,085 | $427,500 | $153,585 |
| 2019 | $9,933 | $557,953 | $405,000 | $152,953 |
| 2018 | $9,951 | $554,010 | $405,000 | $149,010 |
| 2017 | $9,313 | $512,573 | $360,000 | $152,573 |
| 2016 | $9,308 | $503,081 | $0 | $0 |
| 2015 | $9,223 | $487,171 | $0 | $0 |
| 2014 | $8,674 | $469,091 | $0 | $0 |
Source: Public Records
Map
Nearby Homes