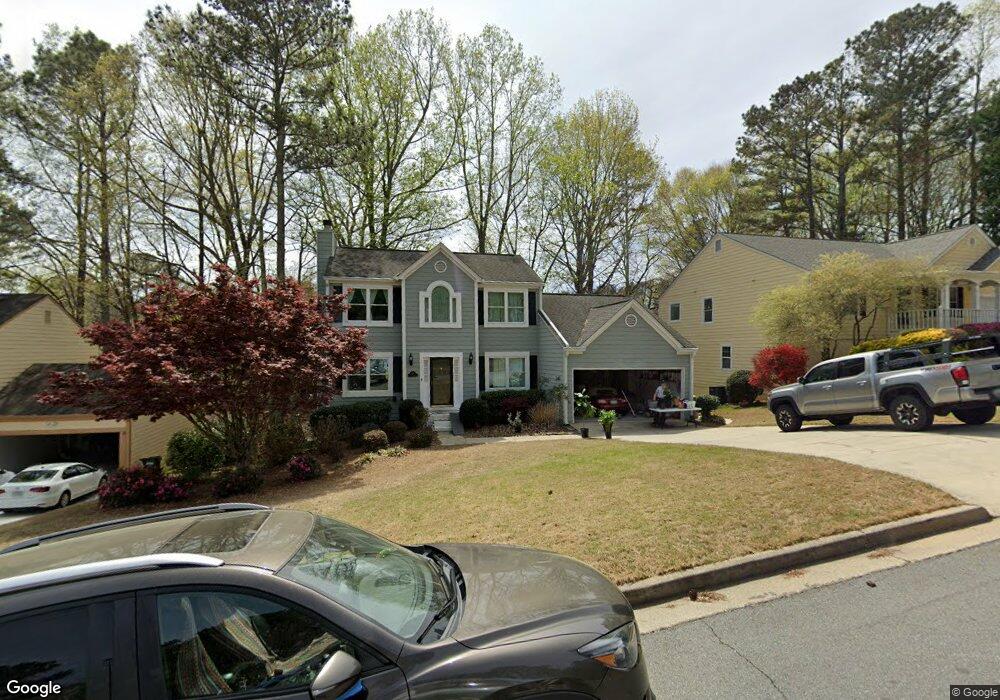
525 Old Preston Trail Alpharetta, GA 30022
Newtown NeighborhoodEstimated Value: $449,701 - $563,000
3
Beds
3
Baths
1,870
Sq Ft
$271/Sq Ft
Est. Value
About This Home
This home is located at 525 Old Preston Trail, Alpharetta, GA 30022 and is currently estimated at $506,175, approximately $270 per square foot. 525 Old Preston Trail is a home located in Fulton County with nearby schools including Barnwell Elementary School, Autrey Mill Middle School, and Johns Creek High School.
Ownership History
Date
Name
Owned For
Owner Type
Purchase Details
Closed on
Mar 26, 2019
Sold by
Laury Beth D
Bought by
Laury Beth D and Laury Michael Alan
Current Estimated Value
Purchase Details
Closed on
Mar 26, 2001
Sold by
Laury Beth D
Bought by
Laury Michael A and Laury Beth D
Home Financials for this Owner
Home Financials are based on the most recent Mortgage that was taken out on this home.
Original Mortgage
$136,000
Interest Rate
7.02%
Mortgage Type
New Conventional
Purchase Details
Closed on
Dec 5, 1996
Sold by
Avena Andrew
Bought by
Smart Beth
Create a Home Valuation Report for This Property
The Home Valuation Report is an in-depth analysis detailing your home's value as well as a comparison with similar homes in the area
Home Values in the Area
Average Home Value in this Area
Purchase History
| Date | Buyer | Sale Price | Title Company |
|---|---|---|---|
| Laury Beth D | -- | -- | |
| Laury Michael A | -- | -- | |
| Smart Beth | $133,000 | -- |
Source: Public Records
Mortgage History
| Date | Status | Borrower | Loan Amount |
|---|---|---|---|
| Previous Owner | Laury Michael A | $136,000 | |
| Closed | Smart Beth | $0 |
Source: Public Records
Tax History Compared to Growth
Tax History
| Year | Tax Paid | Tax Assessment Tax Assessment Total Assessment is a certain percentage of the fair market value that is determined by local assessors to be the total taxable value of land and additions on the property. | Land | Improvement |
|---|---|---|---|---|
| 2025 | $2,699 | $151,960 | $41,120 | $110,840 |
| 2023 | $3,739 | $132,480 | $27,560 | $104,920 |
| 2022 | $2,592 | $132,480 | $27,560 | $104,920 |
| 2021 | $2,561 | $117,560 | $31,320 | $86,240 |
| 2020 | $2,576 | $116,160 | $30,920 | $85,240 |
| 2019 | $313 | $116,960 | $29,800 | $87,160 |
| 2018 | $2,827 | $104,480 | $29,160 | $75,320 |
| 2017 | $2,522 | $86,640 | $24,040 | $62,600 |
| 2016 | $2,466 | $86,640 | $24,040 | $62,600 |
| 2015 | $2,492 | $86,640 | $24,040 | $62,600 |
| 2014 | $2,146 | $73,880 | $15,440 | $58,440 |
Source: Public Records
Map
Nearby Homes
- 615 S Preston Ct
- 595 Oak Alley Way
- 9715 Almaviva Dr
- 320 Outwood Mill Ct
- 9675 Almaviva Dr
- 10000 Barston Ct
- 545 Oak Bridge Trail
- 515 Oak Bridge Trail
- 3765 Redcoat Way
- 201 Downing Dr Unit 76
- 3450 Merganser Ln
- 10085 Old Woodland Entry
- 1210 Cromwell Ct
- 130 Forrest View Terrace
- 10050 Lauren Hall Ct
- 710 Leeds Garden Terrace
- 305 Birch Rill Dr
- 385 Birch Rill Dr
- 3077 Haynes Trail
- 140 Old Sandhurst Landing
- 515 Old Preston Trail
- 535 Old Preston Trail Unit 1
- 430 S Preston Trail Unit 2
- 440 S Preston Trail Unit 2
- 170 Preston Oaks Dr
- 545 Old Preston Trail Unit 1
- 420 S Preston Trail
- 520 Old Preston Trail
- 510 Old Preston Trail
- 450 S Preston Trail Unit 2
- 150 Preston Oaks Dr Unit I
- 460 S Preston Trail
- S S Preston Trail
- 555 Old Preston Trail
- 410 S Preston Trail
- 540 Old Preston Trail
- 530 Old Preston Trail Unit 1
- 315 Old Preston Ct Unit Basement
- 315 Old Preston Ct
- 470 S Preston Trail Unit 2