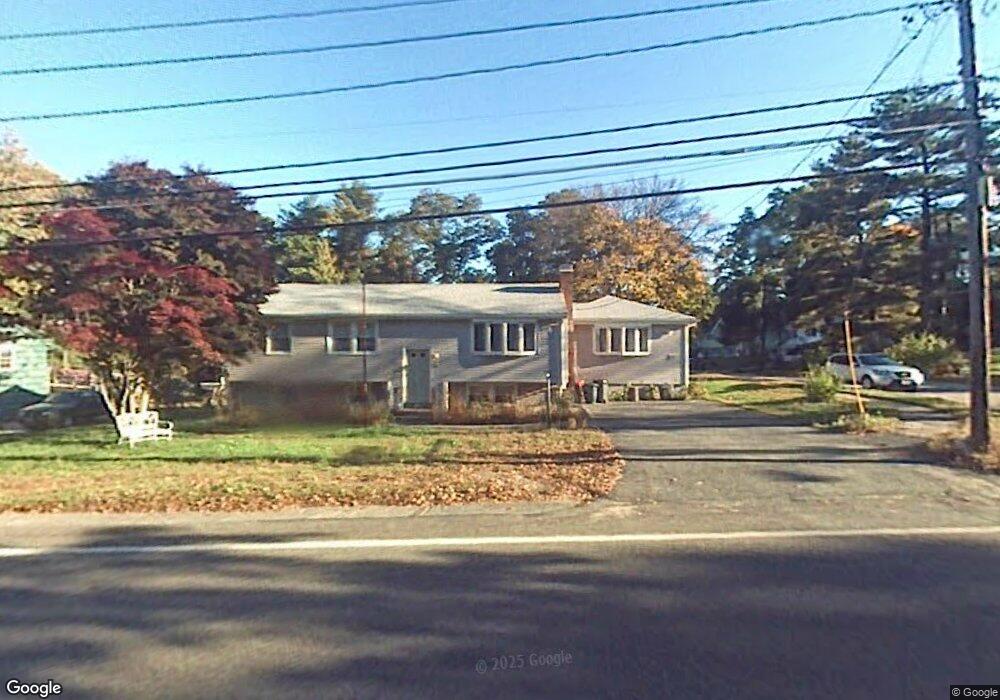
525 Pleasant St Stoughton, MA 02072
Estimated Value: $654,000 - $697,906
3
Beds
2
Baths
2,000
Sq Ft
$340/Sq Ft
Est. Value
About This Home
This home is located at 525 Pleasant St, Stoughton, MA 02072 and is currently estimated at $679,477, approximately $339 per square foot. 525 Pleasant St is a home located in Norfolk County with nearby schools including Joseph R Dawe Jr Elementary School, Dr. Robert G. O'Donnell Middle School, and Stoughton High School.
Ownership History
Date
Name
Owned For
Owner Type
Purchase Details
Closed on
Apr 23, 2024
Sold by
Monaco Robert M and Monaco Maria L
Bought by
Monaco Robert M and Macdonnell Jennife A
Current Estimated Value
Purchase Details
Closed on
Dec 15, 1978
Bought by
Monaco Robert M and Monaco Maria L
Create a Home Valuation Report for This Property
The Home Valuation Report is an in-depth analysis detailing your home's value as well as a comparison with similar homes in the area
Home Values in the Area
Average Home Value in this Area
Purchase History
| Date | Buyer | Sale Price | Title Company |
|---|---|---|---|
| Monaco Robert M | -- | None Available | |
| Monaco Robert M | -- | None Available | |
| Monaco Robert M | -- | None Available | |
| Monaco Robert M | -- | None Available | |
| Monaco Robert M | -- | -- |
Source: Public Records
Mortgage History
| Date | Status | Borrower | Loan Amount |
|---|---|---|---|
| Previous Owner | Monaco Robert M | $30,000 | |
| Previous Owner | Monaco Robert M | $53,000 |
Source: Public Records
Tax History Compared to Growth
Tax History
| Year | Tax Paid | Tax Assessment Tax Assessment Total Assessment is a certain percentage of the fair market value that is determined by local assessors to be the total taxable value of land and additions on the property. | Land | Improvement |
|---|---|---|---|---|
| 2025 | $7,605 | $614,300 | $204,700 | $409,600 |
| 2024 | $7,419 | $582,800 | $187,100 | $395,700 |
| 2023 | $7,139 | $526,900 | $173,000 | $353,900 |
| 2022 | $6,842 | $474,800 | $158,800 | $316,000 |
| 2021 | $6,535 | $432,800 | $135,900 | $296,900 |
| 2020 | $6,185 | $415,400 | $130,600 | $284,800 |
| 2019 | $6,210 | $404,800 | $130,600 | $274,200 |
| 2018 | $5,425 | $366,300 | $123,500 | $242,800 |
| 2017 | $5,019 | $346,400 | $111,200 | $235,200 |
| 2016 | $4,975 | $332,300 | $109,400 | $222,900 |
| 2015 | $4,867 | $321,700 | $98,800 | $222,900 |
| 2014 | $4,774 | $303,300 | $91,800 | $211,500 |
Source: Public Records
Map
Nearby Homes