Estimated Value: $122,134 - $254,000
3
Beds
2
Baths
1,754
Sq Ft
$113/Sq Ft
Est. Value
About This Home
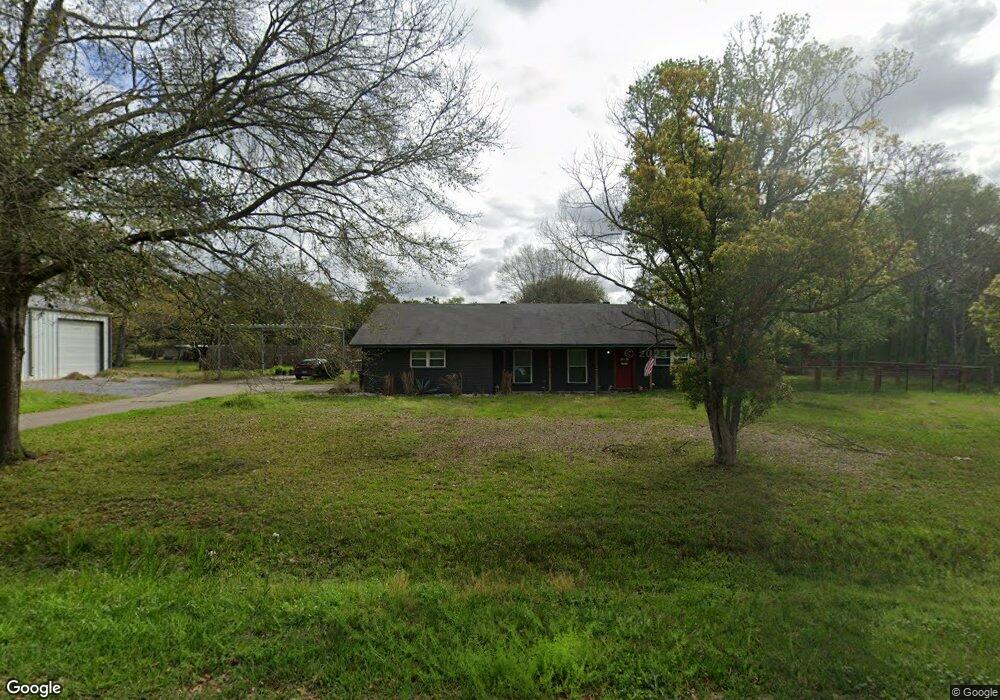
This home is located at 525 Rosewood St, Vidor, TX 77662 and is currently estimated at $197,534, approximately $112 per square foot. 525 Rosewood St is a home located in Orange County with nearby schools including Faith Christian Academy.
Ownership History
Date
Name
Owned For
Owner Type
Purchase Details
Closed on
Oct 1, 2021
Sold by
Baird Samuel and Baird Megan
Bought by
Dekle Cameron and Oakes Michael L
Current Estimated Value
Home Financials for this Owner
Home Financials are based on the most recent Mortgage that was taken out on this home.
Original Mortgage
$195,395
Outstanding Balance
$177,407
Interest Rate
2.8%
Mortgage Type
FHA
Estimated Equity
$20,127
Purchase Details
Closed on
Aug 30, 2019
Sold by
Hall Corey
Bought by
Baird Samuel
Home Financials for this Owner
Home Financials are based on the most recent Mortgage that was taken out on this home.
Original Mortgage
$155,138
Interest Rate
4.12%
Mortgage Type
FHA
Purchase Details
Closed on
Nov 8, 2018
Sold by
Estate Of Mary Eileen Feagin Elliott
Bought by
Hall Corey
Purchase Details
Closed on
Aug 15, 1986
Sold by
Unknown Seller
Bought by
Elliott Mary Eileen
Create a Home Valuation Report for This Property
The Home Valuation Report is an in-depth analysis detailing your home's value as well as a comparison with similar homes in the area
Home Values in the Area
Average Home Value in this Area
Purchase History
| Date | Buyer | Sale Price | Title Company |
|---|---|---|---|
| Dekle Cameron | -- | Capital Title | |
| Baird Samuel | -- | Capital Title | |
| Hall Corey | -- | Capital Title | |
| Elliott Mary Eileen | -- | -- |
Source: Public Records
Mortgage History
| Date | Status | Borrower | Loan Amount |
|---|---|---|---|
| Open | Dekle Cameron | $195,395 | |
| Previous Owner | Baird Samuel | $155,138 |
Source: Public Records
Tax History Compared to Growth
Tax History
| Year | Tax Paid | Tax Assessment Tax Assessment Total Assessment is a certain percentage of the fair market value that is determined by local assessors to be the total taxable value of land and additions on the property. | Land | Improvement |
|---|---|---|---|---|
| 2025 | $2,679 | $107,933 | $7,200 | $100,733 |
| 2024 | $54 | $108,306 | $7,200 | $101,106 |
| 2023 | $4,164 | $121,733 | $7,200 | $114,533 |
| 2022 | $4,164 | $103,135 | $7,200 | $95,935 |
| 2021 | $4,164 | $139,455 | $14,400 | $139,890 |
| 2020 | $3,391 | $111,650 | $14,400 | $97,250 |
| 2019 | $3,148 | $102,630 | $14,400 | $88,230 |
| 2018 | $1,549 | $51,760 | $9,600 | $42,160 |
| 2017 | $1,717 | $93,920 | $9,600 | $84,320 |
| 2016 | $3,014 | $99,710 | $9,600 | $90,110 |
| 2015 | $2,273 | $94,994 | $9,600 | $85,394 |
| 2014 | $2,273 | $92,037 | $9,600 | $82,437 |
Source: Public Records
Map
Nearby Homes
- 285 Lakewood Dr
- 0 School Rd
- 18185 Ih 10
- 490 Concord St Unit 485 Lexington
- 605 N Lakeside St
- 235 Jennings Rd
- 1560 Posey Ln
- 250 Oakland Dr
- 18046 Interstate 10
- 835 Strickland St
- tbd Oakland St
- 1110 S Lakeside St
- 305 Oakland Dr
- 2665 Lincoln St
- 2950 Highway 90
- 16595 Interstate 10
- 2950 Old Highway 90 E
- 1150 S Timberlane
- 970 S Mayhaw Dr
- 955 Aery Rd
- 0000 Rosewood St
- 0000 Rosewood St
- 00000 Rosewood St
- 00 Rosewood St
- 000 Rosewood St
- 520 Rosewood St
- 390 Woodlawn St
- 370 Woodlawn St
- 410 Woodlawn St
- 550 Rosewood St
- 525 Sherwood St
- 505 Sherwood St
- 320 Woodlawn St
- 545 Sherwood St
- 460 Rosewood St
- 415 Rosewood St
- 385 Woodlawn St
- 415 Woodlawn St
- 440 Rosewood St
- 18634 Interstate 10